
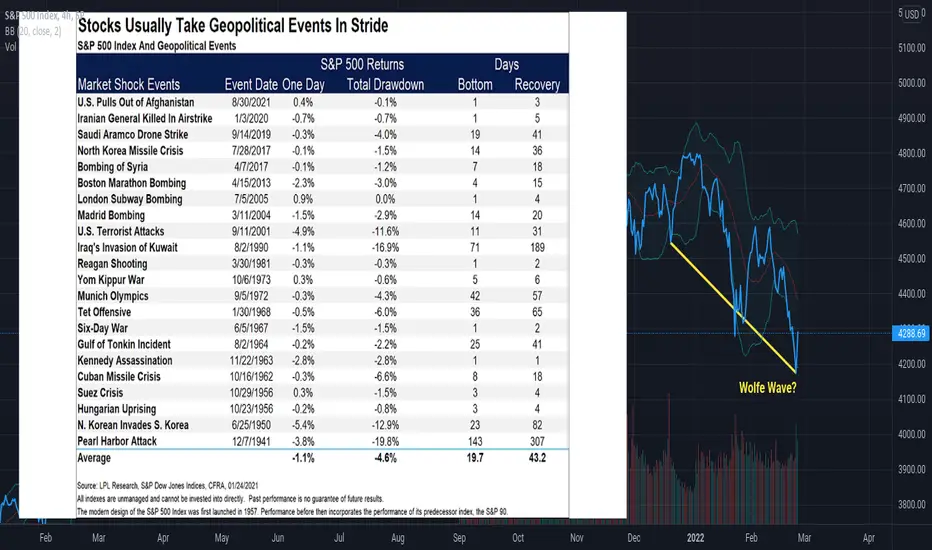
Having an overview how markets react to geopolitical events is crucial.
Here i post the figures from 1941 to 2021. The average bottom and recovery days are very interesting.
Here i post the figures from 1941 to 2021. The average bottom and recovery days are very interesting.
註釋
to have full view of the Image, close Chat and move chart around :)
免責聲明
這些資訊和出版物並非旨在提供,也不構成TradingView提供或認可的任何形式的財務、投資、交易或其他類型的建議或推薦。請閱讀使用條款以了解更多資訊。