
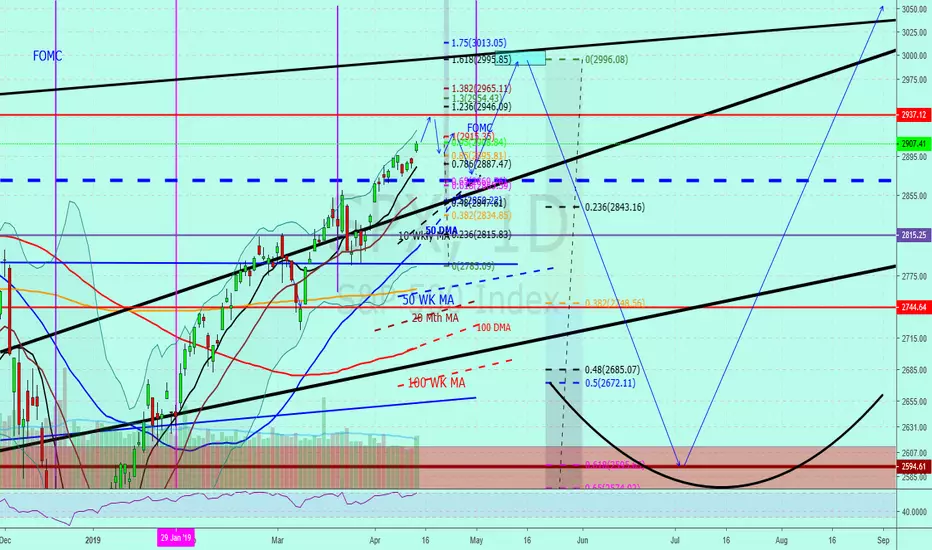
This is my idea of how I believe the SP500 may behave. The larger drop should complete the inverse head and shoulders. And TVIX may have very big gains. GL

註釋
Just one idea. The next couple trading days needs to show me if I am correct. I still think a small wave c needs to be completed and then one last push up to the 3,000 area before we get a much deeper wave 2 correction.
註釋
SP500 update for May 21 2019My preferred count. I am guessing that this rolls over on Thursday night with the UK elections.
註釋
SP 500 Correction finished?? I am not so sure.As you can see...the price has reached halfway between the .236 and .382% Fib. This is not right in my opinion. So I provided an idea to keep an eye on. I will first be watching for price to break above the upper little wedge line that I placed on this chart. Then I will be looking for a zig zag pattern to resemble a B wave. Then I would feel comfortable to expect a waterfall event for price movement down to the typical .618% Fib. That's my thoughts at this point.

免責聲明
這些資訊和出版物並非旨在提供,也不構成TradingView提供或認可的任何形式的財務、投資、交易或其他類型的建議或推薦。請閱讀使用條款以了解更多資訊。