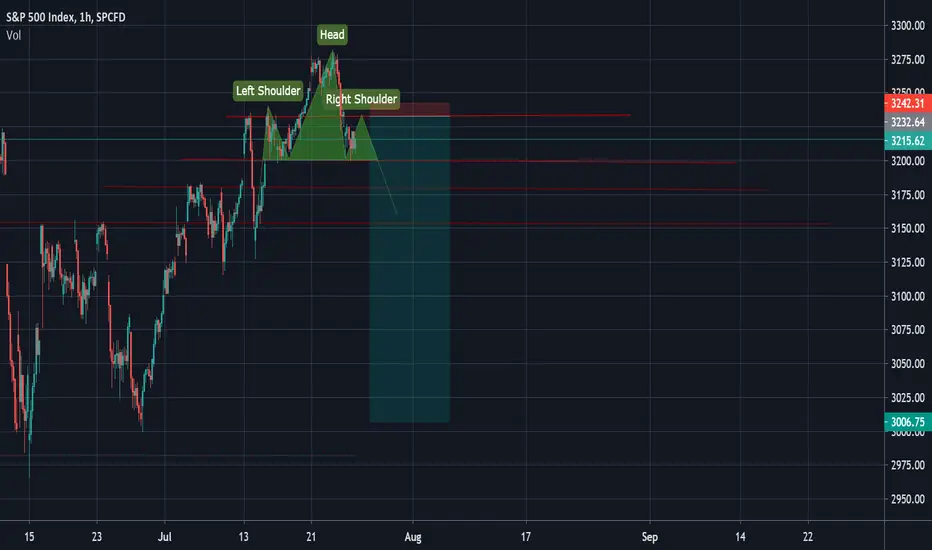
 SPXUSDA double top has formed on the smaller timeframe charts. Broader Outlook - A "head and shoulder" (currently forming the right shoulder) - to prepare for quite an interesting drop. The red lines represent possible support levels as the price journeys down. Comment your thoughts below

免責聲明
這些資訊和出版物並非旨在提供,也不構成TradingView提供或認可的任何形式的財務、投資、交易或其他類型的建議或推薦。請閱讀使用條款以了解更多資訊。