
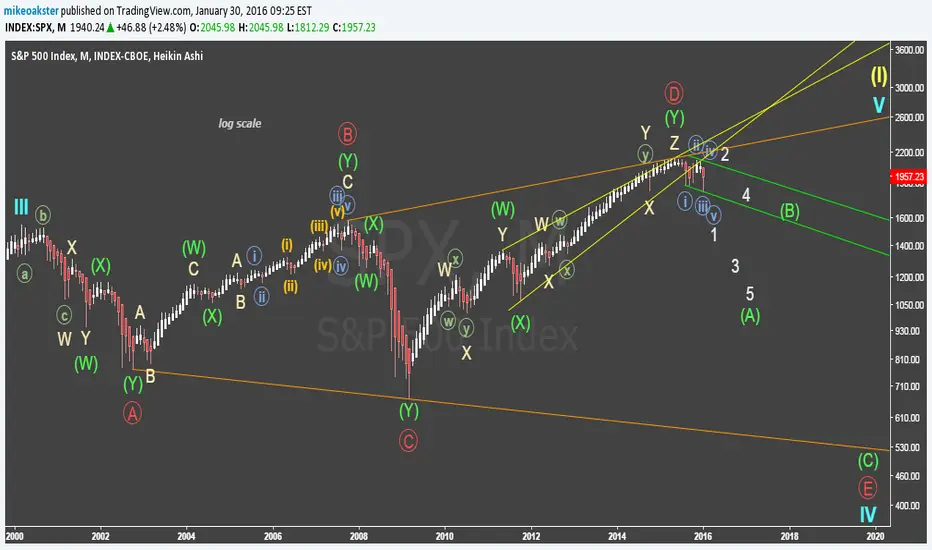
I've just realized that, in the monthly time frame, since March 2000, the only time that bearish price action was verified without being followed by a crash was back in August 2004.
Well, now, January 2016 is the first month since March 2009 which produces bearish price action, and I find it much more similar with the monthly bearish price actions that leaded to the 2000 and 2007 crashes rather than with the one occurred in August 2004...
So, let's see if this month ends up by being one more Intermediate wave X (which would then be followed by a final Intermediate wave Z who knows making a new all time high) or if it is the confirmation of a major crash which would then be probably headed to complete the final Primary E wave of the expanding triangle plotted on the chart.
Well, now, January 2016 is the first month since March 2009 which produces bearish price action, and I find it much more similar with the monthly bearish price actions that leaded to the 2000 and 2007 crashes rather than with the one occurred in August 2004...
So, let's see if this month ends up by being one more Intermediate wave X (which would then be followed by a final Intermediate wave Z who knows making a new all time high) or if it is the confirmation of a major crash which would then be probably headed to complete the final Primary E wave of the expanding triangle plotted on the chart.

相關出版品
免責聲明
這些資訊和出版物並非旨在提供,也不構成TradingView提供或認可的任何形式的財務、投資、交易或其他類型的建議或推薦。請閱讀使用條款以了解更多資訊。