
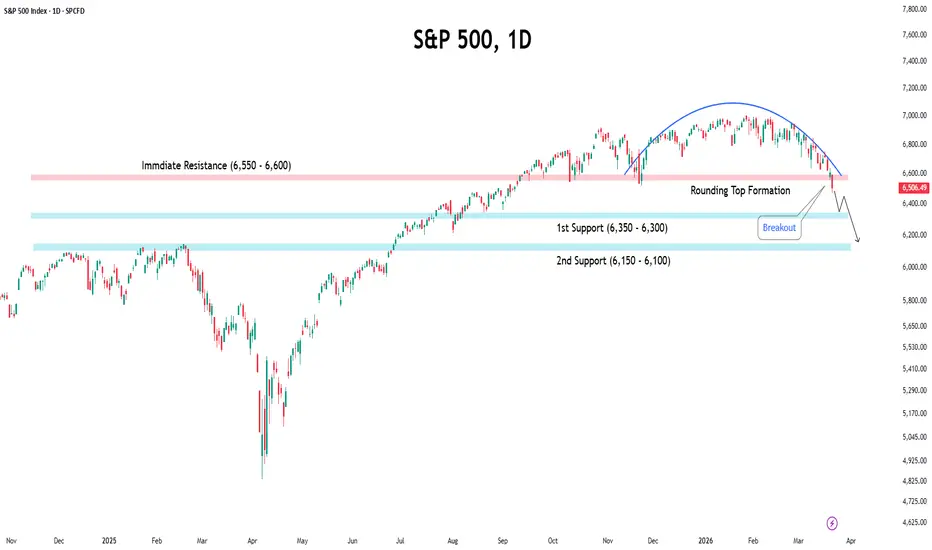
The S&P 500 has dropped to a 6-month low, falling 1.5% in the last session to close at 6,506.
◉ Technical Structure Turns Bearish
From a technical standpoint, the index has formed a rounding top pattern and decisively broken below its neckline. This breakdown indicates a shift in trend, increasing the probability of further downside in the near to medium term.
◉ Key Drivers of the Decline
● Geopolitical tensions: Escalation in the US–Israel–Iran conflict triggered a risk-off sentiment, with concerns over disruption in the Strait of Hormuz.
● Oil price surge:Sharp rise in Crude oil prices has increased inflation fears and reduced expectations of near-term rate cuts.
● Rising bond yields: The US 10-year yield jumped to 4.39%, its highest since July — tightening financial conditions across the board.
● Weak labor data: Signs of softness in the US job market have raised concerns about slowing economic growth.
● Broad-based selling: Most sectors declined, with only energy stocks outperforming due to higher oil prices.
◉ Key Levels to Watch
● 6,550 - 6,600: Now acting as a crucial resistance zone; any pullback below this level is likely to face strong selling pressure.
● 6,350 - 6,300: Immediate downside target and key support for the current corrective phase.
● 6150 - 6,100: Secondary support; a breakdown below this level could accelerate the bearish trend further.
◉ Outlook
The markets has entered into bearish territory — and the technicals and fundamentals are now singing the same tune.
Every bounce below 6,600 is likely a selling opportunity, not a buying one. Until the geopolitical dust settles, oil cools down, and yields pull back, the market trend remains downward.
◉ Technical Structure Turns Bearish
From a technical standpoint, the index has formed a rounding top pattern and decisively broken below its neckline. This breakdown indicates a shift in trend, increasing the probability of further downside in the near to medium term.
◉ Key Drivers of the Decline
● Geopolitical tensions: Escalation in the US–Israel–Iran conflict triggered a risk-off sentiment, with concerns over disruption in the Strait of Hormuz.
● Oil price surge:Sharp rise in Crude oil prices has increased inflation fears and reduced expectations of near-term rate cuts.
● Rising bond yields: The US 10-year yield jumped to 4.39%, its highest since July — tightening financial conditions across the board.
● Weak labor data: Signs of softness in the US job market have raised concerns about slowing economic growth.
● Broad-based selling: Most sectors declined, with only energy stocks outperforming due to higher oil prices.
◉ Key Levels to Watch
● 6,550 - 6,600: Now acting as a crucial resistance zone; any pullback below this level is likely to face strong selling pressure.
● 6,350 - 6,300: Immediate downside target and key support for the current corrective phase.
● 6150 - 6,100: Secondary support; a breakdown below this level could accelerate the bearish trend further.
◉ Outlook
The markets has entered into bearish territory — and the technicals and fundamentals are now singing the same tune.
Every bounce below 6,600 is likely a selling opportunity, not a buying one. Until the geopolitical dust settles, oil cools down, and yields pull back, the market trend remains downward.

🌐 naranjcapital.com
🎖️ CMT (usa) & CFTe (usa) chartered
🇺🇸 Telegram - USA Stocks Trading Advice
t.me/Naranj_USA
🇸🇦 Telegram - Saudi Stocks Trading Advice
t.me/Naranj_KSA
🤝 Contact Us
bio.link/NaranjCapital
🎖️ CMT (usa) & CFTe (usa) chartered
🇺🇸 Telegram - USA Stocks Trading Advice
t.me/Naranj_USA
🇸🇦 Telegram - Saudi Stocks Trading Advice
t.me/Naranj_KSA
🤝 Contact Us
bio.link/NaranjCapital
相關出版品
免責聲明
這些資訊和出版物並非旨在提供,也不構成TradingView提供或認可的任何形式的財務、投資、交易或其他類型的建議或推薦。請閱讀使用條款以了解更多資訊。
🌐 naranjcapital.com
🎖️ CMT (usa) & CFTe (usa) chartered
🇺🇸 Telegram - USA Stocks Trading Advice
t.me/Naranj_USA
🇸🇦 Telegram - Saudi Stocks Trading Advice
t.me/Naranj_KSA
🤝 Contact Us
bio.link/NaranjCapital
🎖️ CMT (usa) & CFTe (usa) chartered
🇺🇸 Telegram - USA Stocks Trading Advice
t.me/Naranj_USA
🇸🇦 Telegram - Saudi Stocks Trading Advice
t.me/Naranj_KSA
🤝 Contact Us
bio.link/NaranjCapital
相關出版品
免責聲明
這些資訊和出版物並非旨在提供,也不構成TradingView提供或認可的任何形式的財務、投資、交易或其他類型的建議或推薦。請閱讀使用條款以了解更多資訊。