
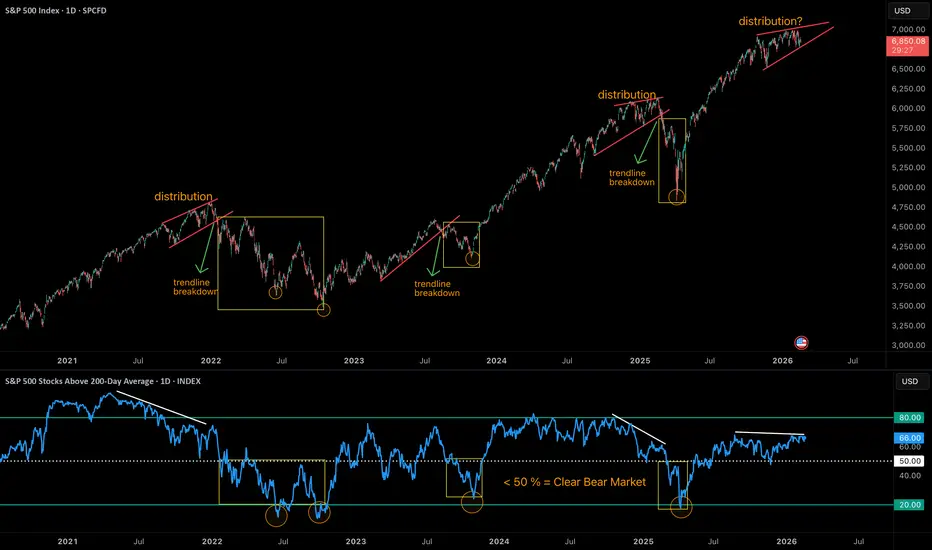
One of the cleanest ways to judge market health is by tracking the % of S&P 500 stocks trading above their 200-day moving average.
In a clear bull market, this number stays comfortably above 50%. Broad participation confirms strength.
Near major tops, we often see divergence — the index moves sideways or marginally higher while fewer stocks participate. Late-stage rallies get narrow. That’s where distribution begins.
However, distribution is only confirmed when price breaks a key trendline or loses a major moving average.
On the other side, extreme readings below 20% typically signal washed-out conditions where durable bottoms can form.
When breadth falls below 50%, it reflects bear market conditions at the index level.
Currently, breadth stands at 66%, while price is moving sideways.
This suggests either:
• A healthy consolidation within an uptrend
• Or early signs of distribution
A decisive trendline breakdown accompanied by breadth slipping below 50% would shift the structure toward a confirmed bear phase.
In a clear bull market, this number stays comfortably above 50%. Broad participation confirms strength.
Near major tops, we often see divergence — the index moves sideways or marginally higher while fewer stocks participate. Late-stage rallies get narrow. That’s where distribution begins.
However, distribution is only confirmed when price breaks a key trendline or loses a major moving average.
On the other side, extreme readings below 20% typically signal washed-out conditions where durable bottoms can form.
When breadth falls below 50%, it reflects bear market conditions at the index level.
Currently, breadth stands at 66%, while price is moving sideways.
This suggests either:
• A healthy consolidation within an uptrend
• Or early signs of distribution
A decisive trendline breakdown accompanied by breadth slipping below 50% would shift the structure toward a confirmed bear phase.

免責聲明
這些資訊和出版物並非旨在提供,也不構成TradingView提供或認可的任何形式的財務、投資、交易或其他類型的建議或推薦。請閱讀使用條款以了解更多資訊。
免責聲明
這些資訊和出版物並非旨在提供,也不構成TradingView提供或認可的任何形式的財務、投資、交易或其他類型的建議或推薦。請閱讀使用條款以了解更多資訊。