
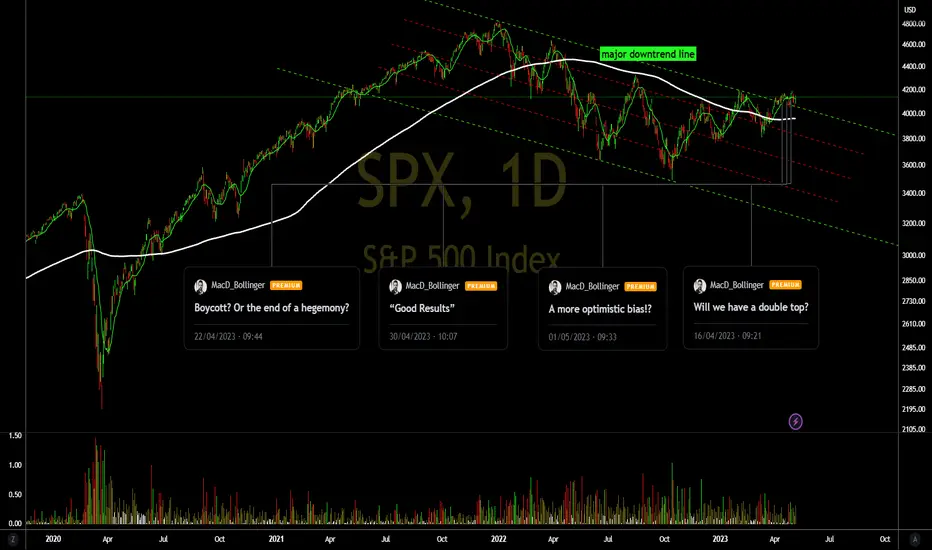
-In previous analysis, prices showed that they could try to force a sharper rise, however, based on technical/graphical analysis, I see that prices tend to only seek the region of 4248.
-If prices do not break through the informed region, we can strongly correct and look for support at 4052.
-On the hourly chart we have prices orbiting the long average, and for me this type of chart pattern is not a very reliable signal, because if prices choose one of the sides to follow (go up or down), they tend to be more intense.

-We have many events to be digested by investors so that we can have at least one path to follow, so caution is the best medicine for the moment!
-See previous graphical analysis!

-Do your analysis and good business.
-Be Aware, If You Buy, Use Stop!
-See below for other graphic analysis.
-If prices do not break through the informed region, we can strongly correct and look for support at 4052.
-On the hourly chart we have prices orbiting the long average, and for me this type of chart pattern is not a very reliable signal, because if prices choose one of the sides to follow (go up or down), they tend to be more intense.
-We have many events to be digested by investors so that we can have at least one path to follow, so caution is the best medicine for the moment!
-See previous graphical analysis!
-Do your analysis and good business.
-Be Aware, If You Buy, Use Stop!
-See below for other graphic analysis.

相關出版品
免責聲明
這些資訊和出版物並非旨在提供,也不構成TradingView提供或認可的任何形式的財務、投資、交易或其他類型的建議或推薦。請閱讀使用條款以了解更多資訊。