
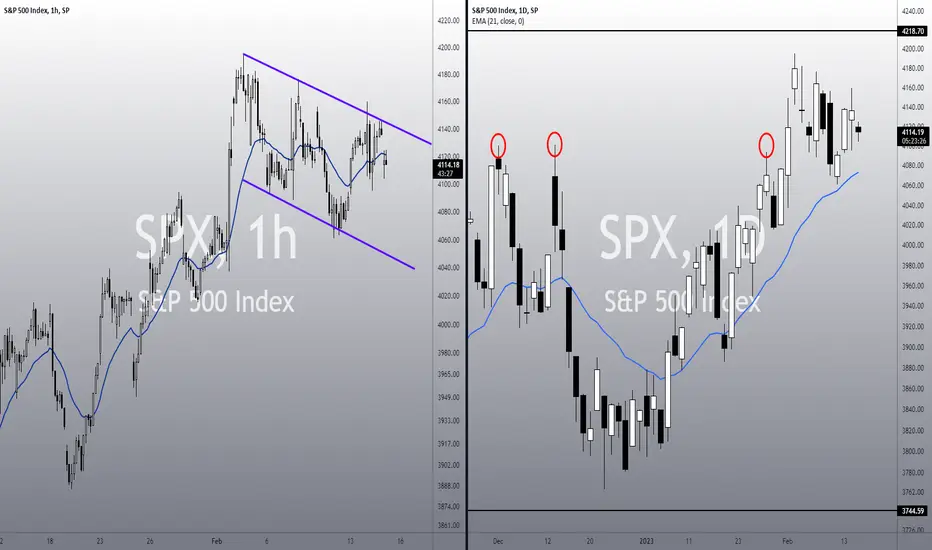
• SPX is inside a Descending Channel, as seen in the 1h chart;
• Despite the bearish momentum in the 1h chart, the trend is still bullish in the daily chart, as the SPX is still doing higher highs/lows and it is above the 21 ema;
• However, if it loses the 21 ema, or does a downwards breakout from this channel, then the bullish bias might reverse in the daily chart (mid-term trend);
• On the other hand, the index would have to do a clear upwards breakout from this channel in order to materialize a bullish continuation pattern;
• This bullish scenario would take us to 4,218, our next target, and an open gap from August last year;
• For now, let’s pay attention on how the index will react inside this channel.
Remember to follow me to keep in touch with my daily analyses!
• Despite the bearish momentum in the 1h chart, the trend is still bullish in the daily chart, as the SPX is still doing higher highs/lows and it is above the 21 ema;
• However, if it loses the 21 ema, or does a downwards breakout from this channel, then the bullish bias might reverse in the daily chart (mid-term trend);
• On the other hand, the index would have to do a clear upwards breakout from this channel in order to materialize a bullish continuation pattern;
• This bullish scenario would take us to 4,218, our next target, and an open gap from August last year;
• For now, let’s pay attention on how the index will react inside this channel.
Remember to follow me to keep in touch with my daily analyses!

免責聲明
這些資訊和出版物並非旨在提供,也不構成TradingView提供或認可的任何形式的財務、投資、交易或其他類型的建議或推薦。請閱讀使用條款以了解更多資訊。