搜尋
產品
社群
市場
經紀商
更多
TW
立即開始
S&P 500指數
做多
已更新
2018年6月19日
SPX Bullish view
2
取得這個圖表
4
240
2018年6月19日
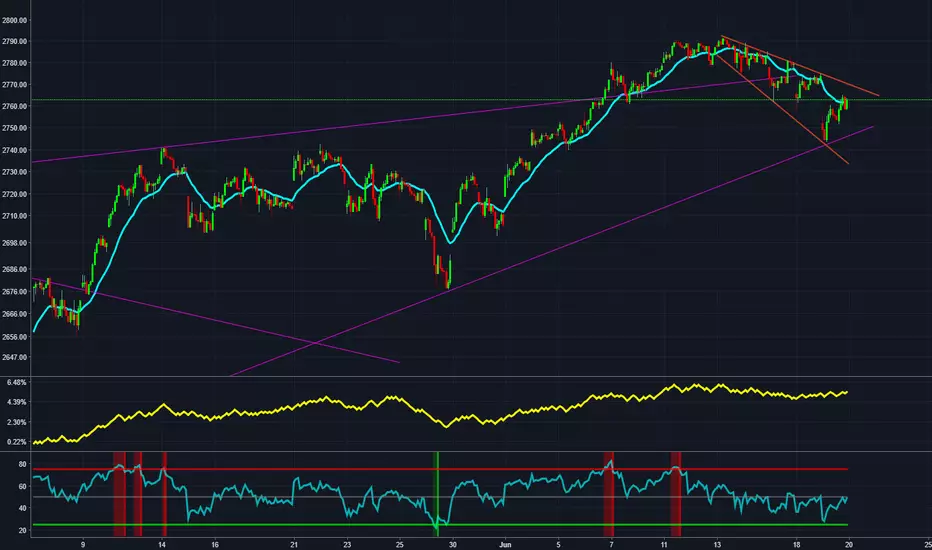
SPX 30 min chart shows a megaphone/flag continuation pattern. Bounced off trendline support today. More bullish than bearish short term.
2018年6月19日
註釋
forexop.com/technical/broadening-wedge-patterns/
vectra-trades
關注
正在關注
此外:
Broadening Wedge
Bullish Patterns
Chart Patterns
LONG
megaphonepattern
SPX (S&P 500 Index)
Trend Analysis
免責聲明
這些資訊和出版物並非旨在提供,也不構成TradingView提供或認可的任何形式的財務、投資、交易或其他類型的建議或推薦。請閱讀
使用條款
以了解更多資訊。
Broadening Wedge
Bullish Patterns
Chart Patterns
LONG
megaphonepattern
SPX (S&P 500 Index)
Trend Analysis
vectra-trades
關注
正在關注
此外:
免責聲明
這些資訊和出版物並非旨在提供,也不構成TradingView提供或認可的任何形式的財務、投資、交易或其他類型的建議或推薦。請閱讀
使用條款
以了解更多資訊。