
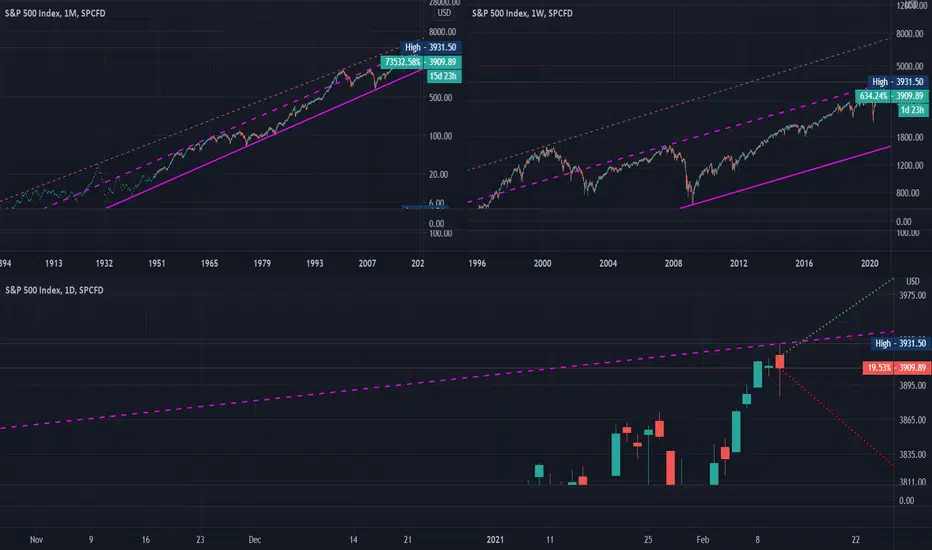
As you can see on these charts-the price is once again beating the channel resistance (purple dotted line). Perhaps the price will have to adjust to the level of $1950, equal to the Fibonacci correction of 0.618%. There is another more positive and desirable scenario for everyone - if there is very good news, the price will be able to gain a foothold above the purple line and go even higher-up to the pink dotted line.
註釋
*logarithmic graph
免責聲明
這些資訊和出版物並非旨在提供,也不構成TradingView提供或認可的任何形式的財務、投資、交易或其他類型的建議或推薦。請閱讀使用條款以了解更多資訊。
免責聲明
這些資訊和出版物並非旨在提供,也不構成TradingView提供或認可的任何形式的財務、投資、交易或其他類型的建議或推薦。請閱讀使用條款以了解更多資訊。