
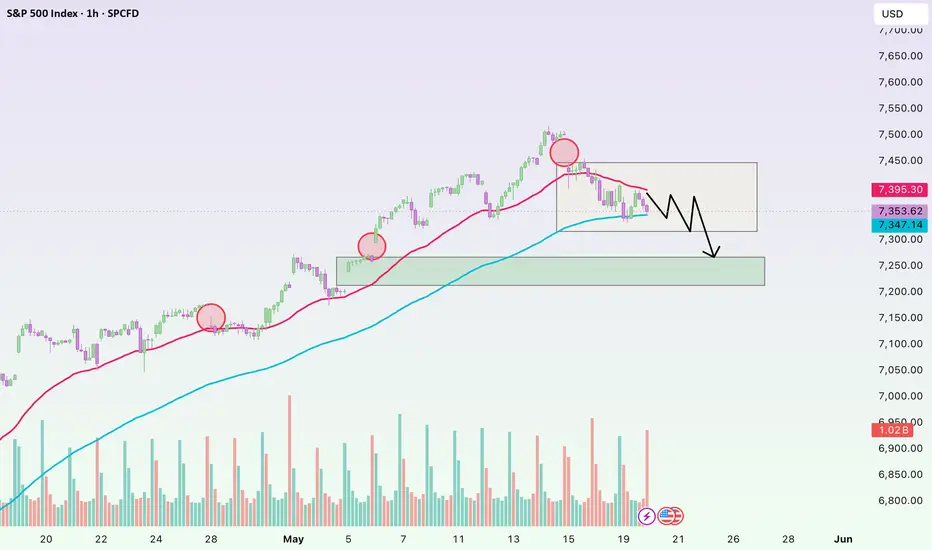
The S&P 500 is beginning to show clearer signs of slowing momentum on the H1 chart after several weeks of almost uninterrupted gains. What stands out to me is that the market is no longer producing the aggressive breakout moves seen earlier in May. Instead, price action has shifted into a sideways structure with repeated pullbacks around EMA34 and EMA89.
At the moment, the index is fluctuating around the 7,350-point area, which coincides with the flat EMA89 zone. This is a very important region because if buyers continue defending this level, the market could still rebound and retest the 7,500-point highs.
However, what makes me more cautious now is the visible loss of bullish momentum. Recent rebounds have lacked strong volume expansion and are often sold off quickly when approaching EMA34. This type of behavior usually appears when the market enters a resting phase after an extended rally.
The positive side is that despite the pullback, the S&P 500 is still holding above EMA89 and there has been no sign of aggressive panic selling yet. This suggests that larger institutional money has not fully exited equities, but is instead shifting toward a more defensive short-term positioning.
At the moment, the index is fluctuating around the 7,350-point area, which coincides with the flat EMA89 zone. This is a very important region because if buyers continue defending this level, the market could still rebound and retest the 7,500-point highs.
However, what makes me more cautious now is the visible loss of bullish momentum. Recent rebounds have lacked strong volume expansion and are often sold off quickly when approaching EMA34. This type of behavior usually appears when the market enters a resting phase after an extended rally.
The positive side is that despite the pullback, the S&P 500 is still holding above EMA89 and there has been no sign of aggressive panic selling yet. This suggests that larger institutional money has not fully exited equities, but is instead shifting toward a more defensive short-term positioning.

Join our group and unlock real-time Forex, gold, and crypto signals — sharp insights, fast alerts, and opportunities you don’t want to miss.
Join now: t.me/+dfxDTk_DRtg4Mzll
Join now: t.me/+dfxDTk_DRtg4Mzll
相關出版品
免責聲明
這些資訊和出版物並非旨在提供,也不構成TradingView提供或認可的任何形式的財務、投資、交易或其他類型的建議或推薦。請閱讀使用條款以了解更多資訊。
Join our group and unlock real-time Forex, gold, and crypto signals — sharp insights, fast alerts, and opportunities you don’t want to miss.
Join now: t.me/+dfxDTk_DRtg4Mzll
Join now: t.me/+dfxDTk_DRtg4Mzll
相關出版品
免責聲明
這些資訊和出版物並非旨在提供,也不構成TradingView提供或認可的任何形式的財務、投資、交易或其他類型的建議或推薦。請閱讀使用條款以了解更多資訊。