
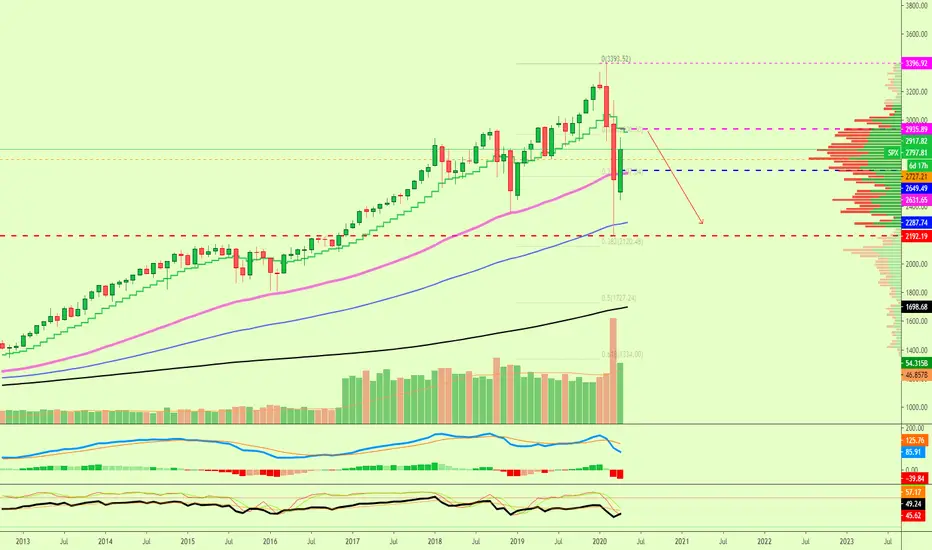
I was looking at the target that I shared for the "upcoming" drop and wrote on it "Worst-case scenario"... but really I didn't mean this and I actually believe that prices can go even lower in a worst-case scenario.
I wanted to share the updated target here in the case a very bad scenario is printed on this chart.
Below you can find the yearly chart (12 Months per candle) and the updated "worst-case scenario" target

If it gets really bad, then 1330 can easily break and prices go lower and hit 770+ before reversing up.
Below you can find the previous chart:
Thanks a lot for reading.
Namaste.
I wanted to share the updated target here in the case a very bad scenario is printed on this chart.
Below you can find the yearly chart (12 Months per candle) and the updated "worst-case scenario" target
If it gets really bad, then 1330 can easily break and prices go lower and hit 770+ before reversing up.
Below you can find the previous chart:
Thanks a lot for reading.
Namaste.

✅ Cryptocurrencies technical analysis & results
t.me/masteranandatrades/9279
✅ Stocks technical analysis
t.me/anandastocks
✅ PREMIUM · Enjoyed the content?
t.me/lamatrades/4 (🔝 since 2017)
t.me/masteranandatrades/9279
✅ Stocks technical analysis
t.me/anandastocks
✅ PREMIUM · Enjoyed the content?
t.me/lamatrades/4 (🔝 since 2017)
免責聲明
這些資訊和出版物並非旨在提供,也不構成TradingView提供或認可的任何形式的財務、投資、交易或其他類型的建議或推薦。請閱讀使用條款以了解更多資訊。
✅ Cryptocurrencies technical analysis & results
t.me/masteranandatrades/9279
✅ Stocks technical analysis
t.me/anandastocks
✅ PREMIUM · Enjoyed the content?
t.me/lamatrades/4 (🔝 since 2017)
t.me/masteranandatrades/9279
✅ Stocks technical analysis
t.me/anandastocks
✅ PREMIUM · Enjoyed the content?
t.me/lamatrades/4 (🔝 since 2017)
免責聲明
這些資訊和出版物並非旨在提供,也不構成TradingView提供或認可的任何形式的財務、投資、交易或其他類型的建議或推薦。請閱讀使用條款以了解更多資訊。