
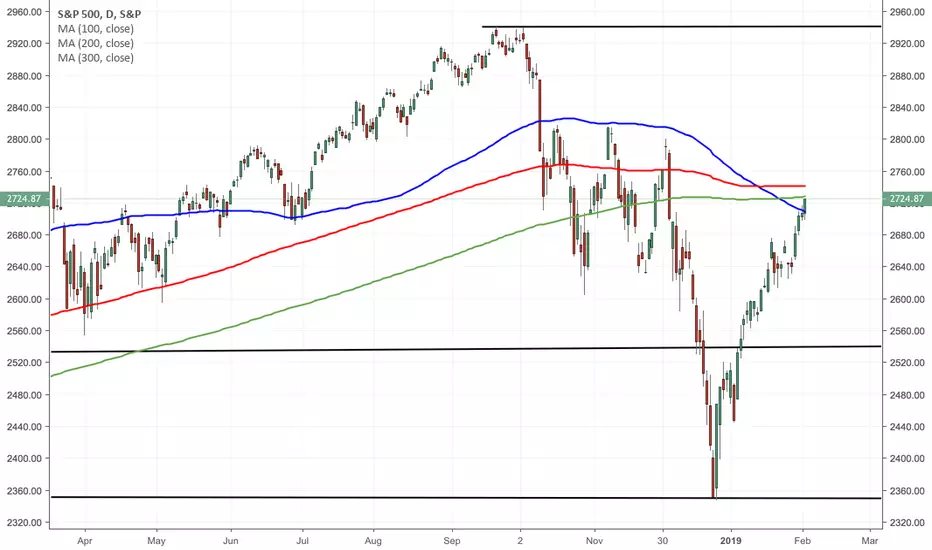
The S&P 500 has done well to break through the 100 moving average on the 1 yr chart
If it breaks through the 300 day and the 200 day we could continue to see an uptrend for a bit
If it breaks through the 300 day and the 200 day we could continue to see an uptrend for a bit
註釋
bounced off 200 day MA and remains just around the 100 day mahard to know which way it'll go, though there is not immediate danger IMO
Feel free to comment!

免責聲明
這些資訊和出版物並非旨在提供,也不構成TradingView提供或認可的任何形式的財務、投資、交易或其他類型的建議或推薦。請閱讀使用條款以了解更多資訊。