
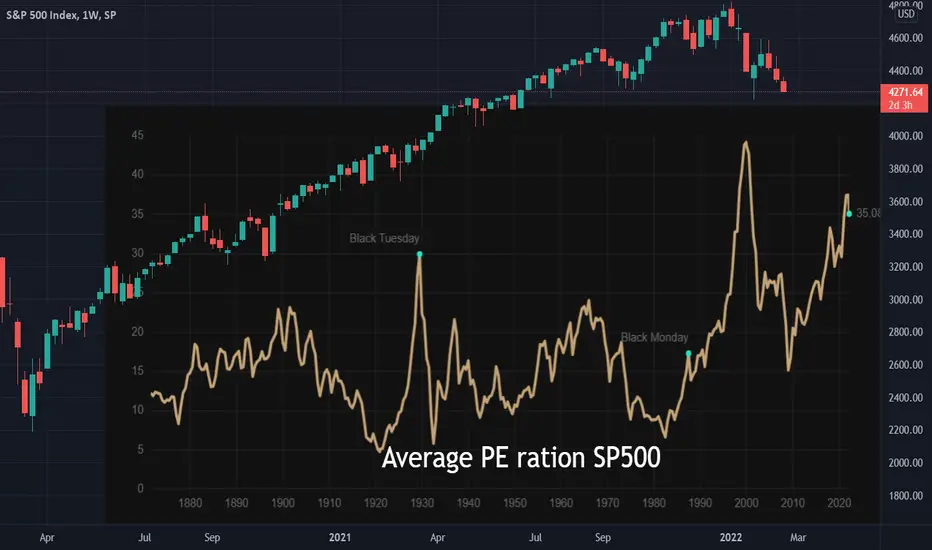
PE, aka price-to-earnings ratio is basic gauge of how much investors are willing to pay in relation to earnings potential
註釋
To clarify: the Average PE Ratio chart runs through 1880 to 2022.
免責聲明
這些資訊和出版物並非旨在提供,也不構成TradingView提供或認可的任何形式的財務、投資、交易或其他類型的建議或推薦。請閱讀使用條款以了解更多資訊。