
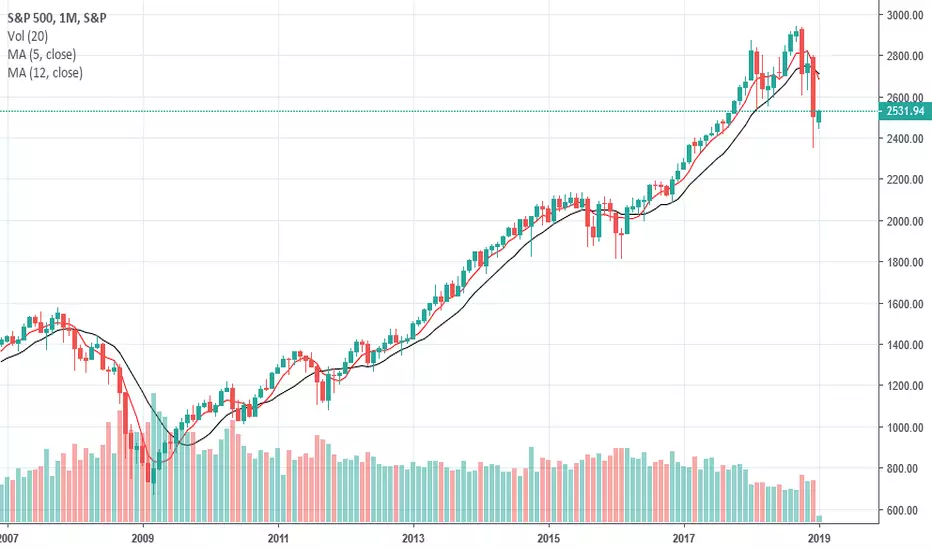
I am not the originator of this idea, but found it on the following website. I created a chart for it so as to get real time indications of short term / long term moving average cross-overs. 5 month is used for short and 12 month for long. This is a market timing indicator.
retirementoptimizer.com/
retirementoptimizer.com/

免責聲明
這些資訊和出版物並非旨在提供,也不構成TradingView提供或認可的任何形式的財務、投資、交易或其他類型的建議或推薦。請閱讀使用條款以了解更多資訊。
免責聲明
這些資訊和出版物並非旨在提供,也不構成TradingView提供或認可的任何形式的財務、投資、交易或其他類型的建議或推薦。請閱讀使用條款以了解更多資訊。