S&P 500 ( SPX) 15m Technical Matrix:
### 🇺🇸 S&P 500 ($SPCFD / SPX) 15-Minute Intraday Technical Matrix (Ref: SPX_2026-11-02_09-15-00.png)
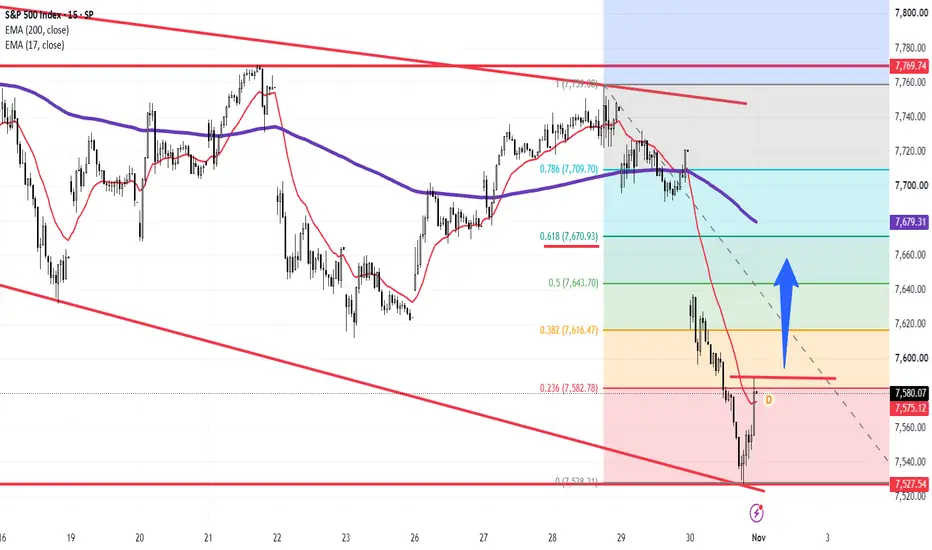
We are issuing an updated 15-minute intraday technical study for the S&P 500 Index ($SPCFD) as November trading opens. Following a steep downside liquidation wave that drove prices directly into the macro ascending/descending channel support floor at **7,528.31**, price action has triggered an aggressive technical mean-reversion rebound.
The index is currently trading at **7,580.07 (-0.88%)**, having successfully reclaimed its trailing **17-EMA (7,575.12)** and pressing against the immediate **0.236 Fibonacci retracement barrier (7,582.78)**.
---
### 🔍 Technical Architecture & Level Roadmap:
1. **Immediate Demand Base & Swing Low Support:**
* **Macro Channel Floor / Fib 0.000:** **7,528.31** (red horizontal line / lower trendline) — Critical structural support zone where buyers absorbed heavy selling volume and established the recent intraday low.
2. **Fibonacci Recovery Target Grid (Impulse Vector - Blue Arrow):**
* **Immediate Dynamic Support (17-EMA):** **7,575.12** (red line) — Short-term dynamic floor currently protecting the recovery wave.
* **0.236 Retracement Level:** **7,582.78** (red dashed line) — Immediate breakout hurdle.
* **0.382 Retracement Node:** **7,616.47** — Intermediate supply target.
* **0.500 Retracement Level:** **7,643.70** — Mid-range equilibrium target.
* **0.618 Golden Pocket:** **7,670.93** — Major structural resistance zone.
* **0.786 Retracement Level:** **7,709.70** — Aligns near the **200-EMA (7,679.31)** and secondary overhead resistance.
* **1.000 Range Ceiling:** **7,759.08** — Major structural swing high.
---
### 🛡️ Strategic Operational Scenarios:
* **Scenario A — Bullish Mean-Reversion Bounce (Primary Expectation - Blue Arrow):** Sustained trading above the **17-EMA (7,575.12)** and a decisive 15m candle close above **7,582.78 (0.236 Fib)** confirms momentum continuation, opening a recovery vector toward **7,616.47 (0.382 Fib)** and **7,643.70 (0.500 Fib)**.
* **Scenario B — Rejection & Support Re-Test:** Failure to break above **7,582.78** combined with a loss of the **17-EMA (7,575.12)** exposes the index to a re-test of the lower channel base around **7,528.31**.
### 📊 Tactical Parameters Summary:
* **Current Bias:** Intraday Bullish Rebound / Technical Mean-Reversion
* **Execution Price:** 7,580.07[cite: 15]
* **Immediate Dynamic Support (17-EMA):** 7,575.12[cite: 15]
* **Immediate Resistance Pivot (0.236 Fib):** 7,582.78[cite: 15]
* **Primary Recovery Targets:** 7,616.47 (Fib 0.382) / 7,643.70 (Fib 0.500)
* **Structural Swing Low Base:** 7,528.31[cite: 15]
---
📊 **ChartPro Data**
*US Equity Index Intraday Architecture, Fibonacci Retracements & Systematic Risk Control.*
⚠️ **Disclaimer:** Educational study only. Not financial advice. Maintain disciplined position sizing and strict risk management protocols.
SPX) 15m Technical Matrix: ### 🇺🇸 S&P 500 ($SPCFD / SPX) 15-Minute Intraday Technical Matrix (Ref: SPX_2026-11-02_09-15-00.png)
We are issuing an updated 15-minute intraday technical study for the S&P 500 Index ($SPCFD) as November trading opens. Following a steep downside liquidation wave that drove prices directly into the macro ascending/descending channel support floor at **7,528.31**, price action has triggered an aggressive technical mean-reversion rebound.
The index is currently trading at **7,580.07 (-0.88%)**, having successfully reclaimed its trailing **17-EMA (7,575.12)** and pressing against the immediate **0.236 Fibonacci retracement barrier (7,582.78)**.
---
### 🔍 Technical Architecture & Level Roadmap:
1. **Immediate Demand Base & Swing Low Support:**
* **Macro Channel Floor / Fib 0.000:** **7,528.31** (red horizontal line / lower trendline) — Critical structural support zone where buyers absorbed heavy selling volume and established the recent intraday low.
2. **Fibonacci Recovery Target Grid (Impulse Vector - Blue Arrow):**
* **Immediate Dynamic Support (17-EMA):** **7,575.12** (red line) — Short-term dynamic floor currently protecting the recovery wave.
* **0.236 Retracement Level:** **7,582.78** (red dashed line) — Immediate breakout hurdle.
* **0.382 Retracement Node:** **7,616.47** — Intermediate supply target.
* **0.500 Retracement Level:** **7,643.70** — Mid-range equilibrium target.
* **0.618 Golden Pocket:** **7,670.93** — Major structural resistance zone.
* **0.786 Retracement Level:** **7,709.70** — Aligns near the **200-EMA (7,679.31)** and secondary overhead resistance.
* **1.000 Range Ceiling:** **7,759.08** — Major structural swing high.
---
### 🛡️ Strategic Operational Scenarios:
* **Scenario A — Bullish Mean-Reversion Bounce (Primary Expectation - Blue Arrow):** Sustained trading above the **17-EMA (7,575.12)** and a decisive 15m candle close above **7,582.78 (0.236 Fib)** confirms momentum continuation, opening a recovery vector toward **7,616.47 (0.382 Fib)** and **7,643.70 (0.500 Fib)**.
* **Scenario B — Rejection & Support Re-Test:** Failure to break above **7,582.78** combined with a loss of the **17-EMA (7,575.12)** exposes the index to a re-test of the lower channel base around **7,528.31**.
### 📊 Tactical Parameters Summary:
* **Current Bias:** Intraday Bullish Rebound / Technical Mean-Reversion
* **Execution Price:** 7,580.07[cite: 15]
* **Immediate Dynamic Support (17-EMA):** 7,575.12[cite: 15]
* **Immediate Resistance Pivot (0.236 Fib):** 7,582.78[cite: 15]
* **Primary Recovery Targets:** 7,616.47 (Fib 0.382) / 7,643.70 (Fib 0.500)
* **Structural Swing Low Base:** 7,528.31[cite: 15]
---
📊 **ChartPro Data**
*US Equity Index Intraday Architecture, Fibonacci Retracements & Systematic Risk Control.*
⚠️ **Disclaimer:** Educational study only. Not financial advice. Maintain disciplined position sizing and strict risk management protocols.

免責聲明
這些資訊和出版物並非旨在提供,也不構成TradingView提供或認可的任何形式的財務、投資、交易或其他類型的建議或推薦。請閱讀使用條款以了解更多資訊。
免責聲明
這些資訊和出版物並非旨在提供,也不構成TradingView提供或認可的任何形式的財務、投資、交易或其他類型的建議或推薦。請閱讀使用條款以了解更多資訊。