
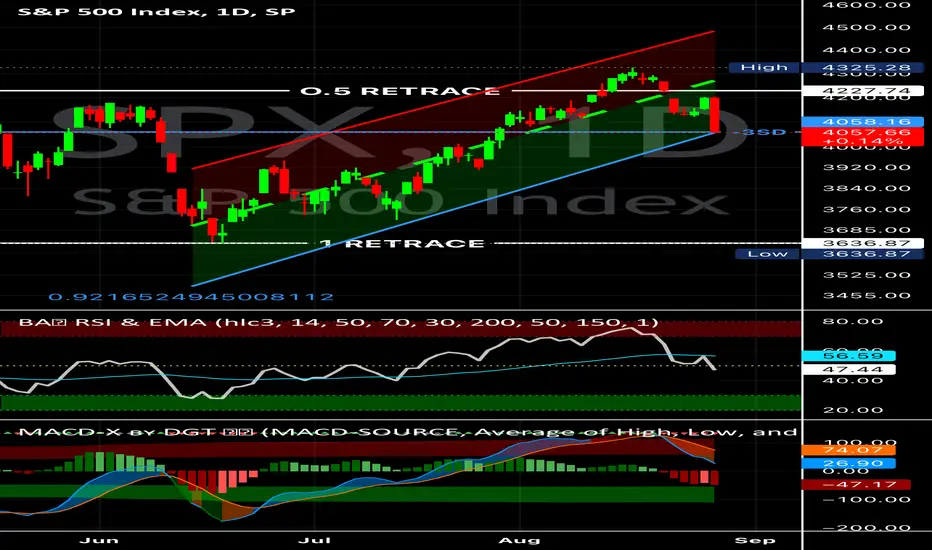
With the SPX rallying over 18% from trough to peak over the last few weeks it looks like the recent upward trend could be under threat.
As we can see on the chart above price is threatening to breach the lower third standard deviation (-3SD) off the linear mean at 4058.16. Given the high central tendency of signal to revert toward the linear mean(Pearson’s R^2 = 0.92), a deviation this far to the edge of the regression channel is not insignificant.
We can also see that our 1 day RSI has gone below its midline into bearish trend territory and our MACD has rolled over with signal exhibiting wide downside divergence at the mouth. These are not bullish signals.
If SPX price action fails to bounce back into the channel next week and falls firmly below the 4K line for a couple days or touches down to the 3850 price region, either of those would be enough to shatter the recent rally from a structural perspective. (Not financial advice.)
As we can see on the chart above price is threatening to breach the lower third standard deviation (-3SD) off the linear mean at 4058.16. Given the high central tendency of signal to revert toward the linear mean(Pearson’s R^2 = 0.92), a deviation this far to the edge of the regression channel is not insignificant.
We can also see that our 1 day RSI has gone below its midline into bearish trend territory and our MACD has rolled over with signal exhibiting wide downside divergence at the mouth. These are not bullish signals.
If SPX price action fails to bounce back into the channel next week and falls firmly below the 4K line for a couple days or touches down to the 3850 price region, either of those would be enough to shatter the recent rally from a structural perspective. (Not financial advice.)
交易結束:目標達成
consider the trend broken!
免責聲明
這些資訊和出版物並非旨在提供,也不構成TradingView提供或認可的任何形式的財務、投資、交易或其他類型的建議或推薦。請閱讀使用條款以了解更多資訊。
免責聲明
這些資訊和出版物並非旨在提供,也不構成TradingView提供或認可的任何形式的財務、投資、交易或其他類型的建議或推薦。請閱讀使用條款以了解更多資訊。