
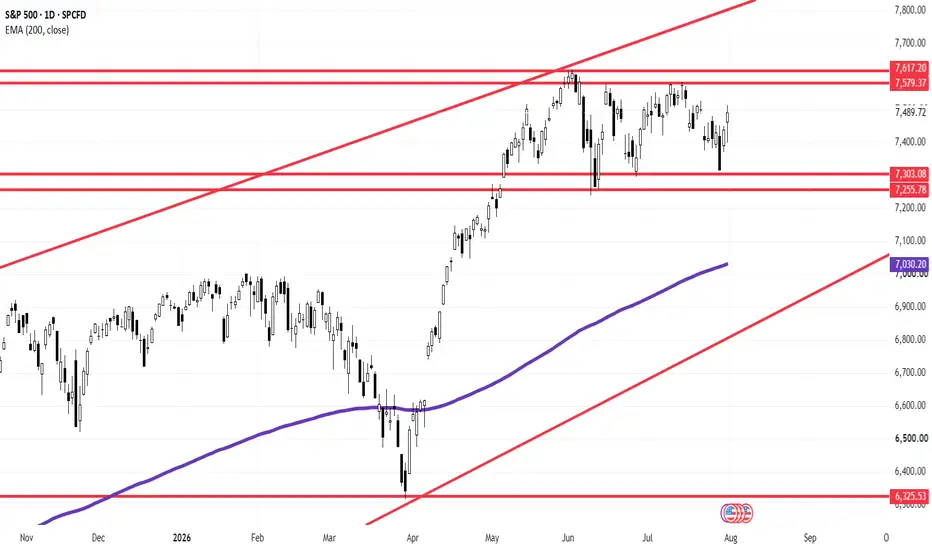
Daily Chart (D1) – Compression Ahead of a Major Volatility Expansion
On the daily timeframe, the S&P 500 (SPX) is currently coiled inside a symmetrical triangle/wedge pattern (green trendlines) following its recent push towards historic highs. This tight consolidation signals that the market is preparing for a significant multi-week directional move once a definitive breakout occurs.
Bullish Continuation Scenario:
The immediate upside hurdle sits at the upper boundary of the green compression structure (~7,550 - 7,580).
A decisive daily close above this trendline clears the pathway for a bullish expansion towards the upper red channel line, targeting 7,700+.
Bearish Correction Scenario:
If the price gets rejected at the upper green trendline and breaks down below the lower support line (~7,320), it will trigger a deeper structural pull-back.
In this breakdown scenario, the primary target for the bears would be the 200-day EMA (currently near 7,030), followed by the primary long-term ascending trendline (red line).
📊 **ChartPro Data**
*European Equity Architecture, Trend Expansion Mechanics & Systematic Risk Management.*
⚠️ **Disclaimer:** For educational and informational purposes only. This active market study represents a personal trading framework and does not constitute financial or investment advice.
On the daily timeframe, the S&P 500 (SPX) is currently coiled inside a symmetrical triangle/wedge pattern (green trendlines) following its recent push towards historic highs. This tight consolidation signals that the market is preparing for a significant multi-week directional move once a definitive breakout occurs.
Bullish Continuation Scenario:
The immediate upside hurdle sits at the upper boundary of the green compression structure (~7,550 - 7,580).
A decisive daily close above this trendline clears the pathway for a bullish expansion towards the upper red channel line, targeting 7,700+.
Bearish Correction Scenario:
If the price gets rejected at the upper green trendline and breaks down below the lower support line (~7,320), it will trigger a deeper structural pull-back.
In this breakdown scenario, the primary target for the bears would be the 200-day EMA (currently near 7,030), followed by the primary long-term ascending trendline (red line).
📊 **ChartPro Data**
*European Equity Architecture, Trend Expansion Mechanics & Systematic Risk Management.*
⚠️ **Disclaimer:** For educational and informational purposes only. This active market study represents a personal trading framework and does not constitute financial or investment advice.

免責聲明
這些資訊和出版物並非旨在提供,也不構成TradingView提供或認可的任何形式的財務、投資、交易或其他類型的建議或推薦。請閱讀使用條款以了解更多資訊。
免責聲明
這些資訊和出版物並非旨在提供,也不構成TradingView提供或認可的任何形式的財務、投資、交易或其他類型的建議或推薦。請閱讀使用條款以了解更多資訊。