
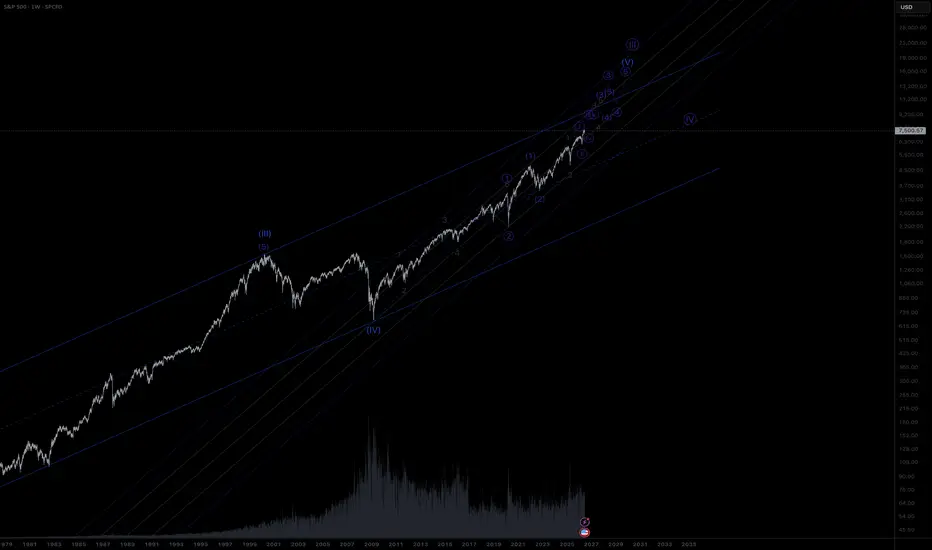
Bull market to continue to 2029-30
As per the last published idea here is the SPX weekly chart with a suggested Elliot Wave count to take us up till 2029-30. After this the correction will either be a Wave IV or a large Wave 1-2 which could be more of a depression in the 2030's.
As per the last published idea here is the SPX weekly chart with a suggested Elliot Wave count to take us up till 2029-30. After this the correction will either be a Wave IV or a large Wave 1-2 which could be more of a depression in the 2030's.

免責聲明
這些資訊和出版物並非旨在提供,也不構成TradingView提供或認可的任何形式的財務、投資、交易或其他類型的建議或推薦。請閱讀使用條款以了解更多資訊。
免責聲明
這些資訊和出版物並非旨在提供,也不構成TradingView提供或認可的任何形式的財務、投資、交易或其他類型的建議或推薦。請閱讀使用條款以了解更多資訊。