
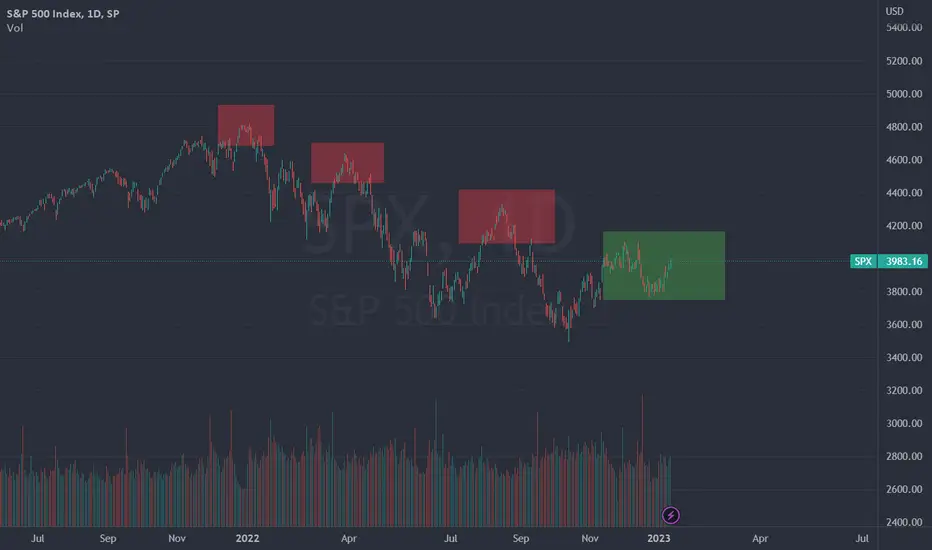
Quick post to those of you who've been following some of my ideas. I had previously drawn the similarity between now and 2008 in terms of chart patterns, but what's playing out seems to be much more like 1968 and 2001. Notice the double tops in green before the crash both had, which closely resembles what we're headed for now. These were also the starts of boom bust cycles happening in sets of 2. With this in mind, I'm adjusting to the 2001 timeline. My new PT is $265 which would hypothetically be at the end of August.


相關出版品
免責聲明
這些資訊和出版物並非旨在提供,也不構成TradingView提供或認可的任何形式的財務、投資、交易或其他類型的建議或推薦。請閱讀使用條款以了解更多資訊。