
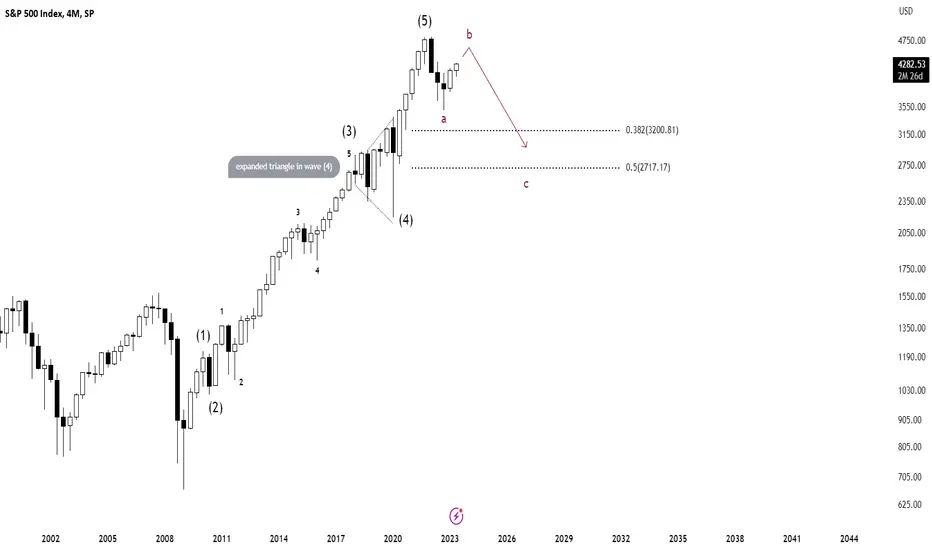
The idea is based on the Elliott Wave Theory. The analysis suggests that an impulse cycle is completed which started in Jan 2009. Based on this count, we are likely to see one more wave down (c) which completes the correction cycle.
The minimum correction point would be 38.2 fib which is at 3200 and then the 50% fib (2700 level).
Wave b often takes time to complete and difficult to predict with accuracy. We may see a close to double-top situation followed by a reversal downwards. It's necessary to manage risk while trading or Investing.

免責聲明
這些資訊和出版物並非旨在提供,也不構成TradingView提供或認可的任何形式的財務、投資、交易或其他類型的建議或推薦。請閱讀使用條款以了解更多資訊。