
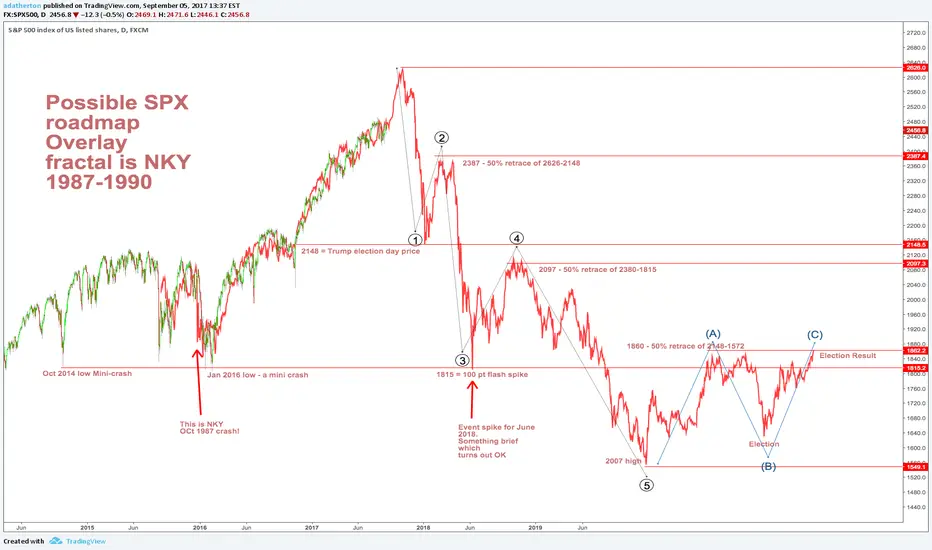
This is based on the Nikkei 225 price action from late 1987 to 1990. The existing action fits well, we are now at early November 1989.
This chart presumes one more fast ramp by SPX to 2620, then a sharp 18% fall wiping out all the Trump gains. This would be followed by a 50% rebound, and then further falls into the next few years, eventually reaching the 2007 high of 1572.
This chart presumes one more fast ramp by SPX to 2620, then a sharp 18% fall wiping out all the Trump gains. This would be followed by a 50% rebound, and then further falls into the next few years, eventually reaching the 2007 high of 1572.

免責聲明
這些資訊和出版物並非旨在提供,也不構成TradingView提供或認可的任何形式的財務、投資、交易或其他類型的建議或推薦。請閱讀使用條款以了解更多資訊。
免責聲明
這些資訊和出版物並非旨在提供,也不構成TradingView提供或認可的任何形式的財務、投資、交易或其他類型的建議或推薦。請閱讀使用條款以了解更多資訊。