
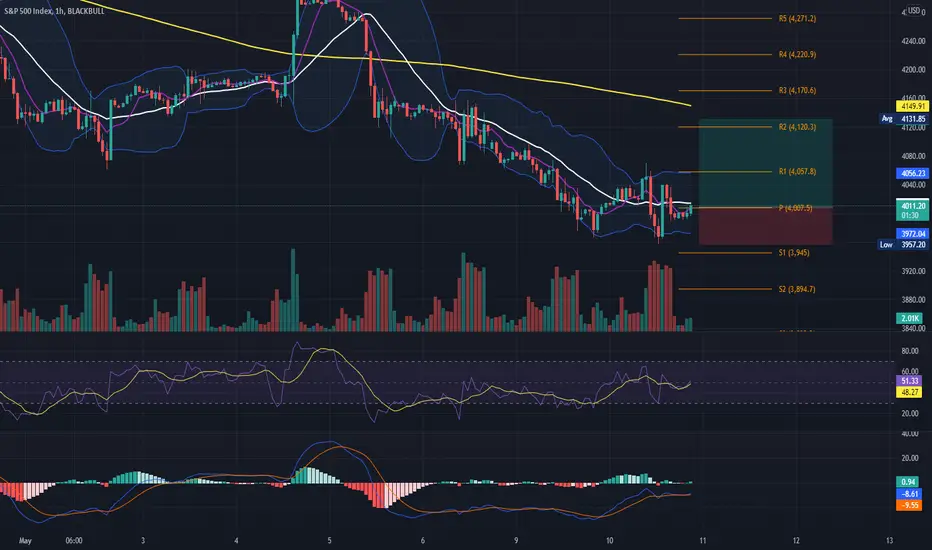
Hey traders, SPX is showing the last correction wave C 1-day frame, which is almost over. The market is bearish, we will see the market going slowly higher, bouncing between the pivot point bands and going up.
Pls remember to check the trend, the price should stay up at the pivot point level and bounce in it, without breaking. If the price goes down the pivot point and then S1, we will switch into a downtrend again.
Pls , see the pivot point levels in the chart.(R1,R2) The market has the last word.
Indicators, MA 200, 20-8 RSI 8 MA8 Bollinger 20, Volume , Pivot points Levels. Intraday Strategy. MACD

免責聲明
這些資訊和出版物並非旨在提供,也不構成TradingView提供或認可的任何形式的財務、投資、交易或其他類型的建議或推薦。請閱讀使用條款以了解更多資訊。