
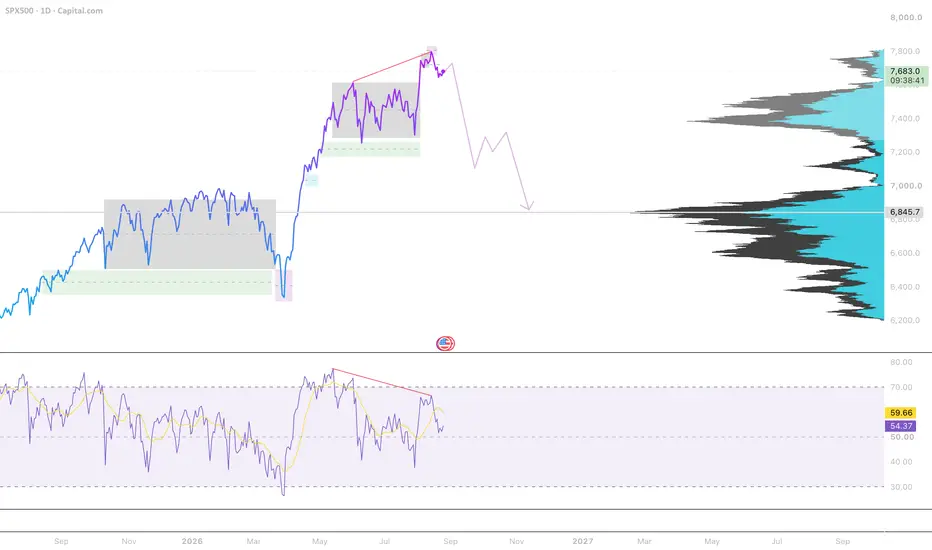
SPX500: Bearish RSI Divergence Signals a Potential Correction
The S&P 500 has broken above its previous consolidation range and reached a new high near 7,800. However, momentum is not confirming the move: while price formed a higher high, the RSI printed a lower high, creating a clear bearish divergence on the daily chart.
This suggests that the current breakout may be losing strength. A final retest of the recent high is still possible, but failure to hold above the breakout area could trigger a broader correction.
My main downside target is the high-volume support zone around 6,845. The move may not happen in a straight line, as intermediate reactions and rebounds are likely around 7,200–7,300.
Key levels:
• Resistance: 7,780–7,820
• Intermediate support: 7,200–7,300
• Main downside target: 6,845
A sustained daily close above the recent high would weaken the bearish scenario.
This is a technical scenario, not financial advice.
The S&P 500 has broken above its previous consolidation range and reached a new high near 7,800. However, momentum is not confirming the move: while price formed a higher high, the RSI printed a lower high, creating a clear bearish divergence on the daily chart.
This suggests that the current breakout may be losing strength. A final retest of the recent high is still possible, but failure to hold above the breakout area could trigger a broader correction.
My main downside target is the high-volume support zone around 6,845. The move may not happen in a straight line, as intermediate reactions and rebounds are likely around 7,200–7,300.
Key levels:
• Resistance: 7,780–7,820
• Intermediate support: 7,200–7,300
• Main downside target: 6,845
A sustained daily close above the recent high would weaken the bearish scenario.
This is a technical scenario, not financial advice.

免責聲明
這些資訊和出版物並非旨在提供,也不構成TradingView提供或認可的任何形式的財務、投資、交易或其他類型的建議或推薦。請閱讀使用條款以了解更多資訊。
免責聲明
這些資訊和出版物並非旨在提供,也不構成TradingView提供或認可的任何形式的財務、投資、交易或其他類型的建議或推薦。請閱讀使用條款以了解更多資訊。