
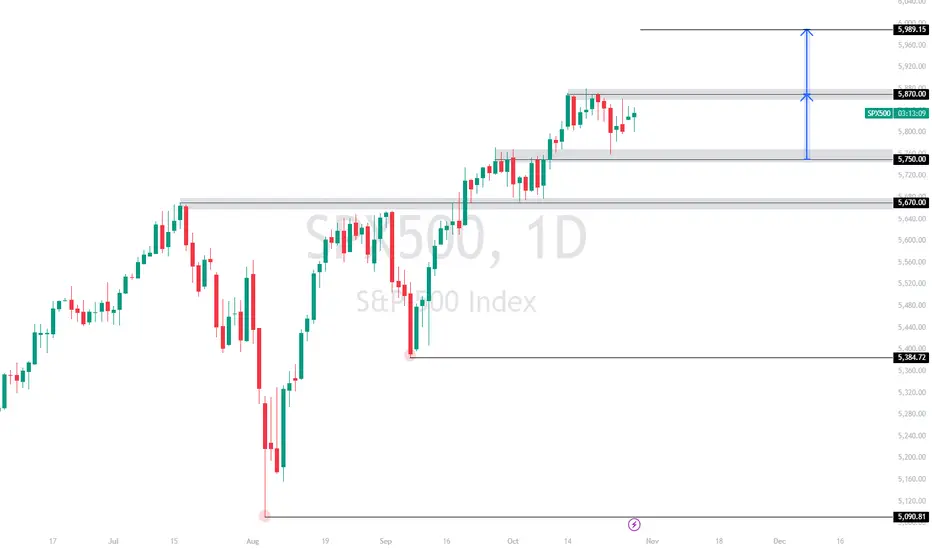
TREND; The S&P 500 index is currently in an uptrend (Bullish), characterized by higher highs and higher lows since mid-August.
PLAN:
• The support zone around 5,670 acted as a base for a recent upward move.
• The 5,870 level seems to be a key resistance area, and price is currently testing this level.
• If the price breaks above the 5,870 resistance level, my potential target will be around 5,989.15.
• Note that the blue arrow indicates the measured move from the support level at 5,750 up to the resistance at 5,870, which could imply the projected target if this breakout occurs.
PLAN:
• The support zone around 5,670 acted as a base for a recent upward move.
• The 5,870 level seems to be a key resistance area, and price is currently testing this level.
• If the price breaks above the 5,870 resistance level, my potential target will be around 5,989.15.
• Note that the blue arrow indicates the measured move from the support level at 5,750 up to the resistance at 5,870, which could imply the projected target if this breakout occurs.

免責聲明
這些資訊和出版物並非旨在提供,也不構成TradingView提供或認可的任何形式的財務、投資、交易或其他類型的建議或推薦。請閱讀使用條款以了解更多資訊。