搜尋
產品
社群
市場
經紀商
更多
TW
立即開始
S&P 500指數
做空
2021年7月13日
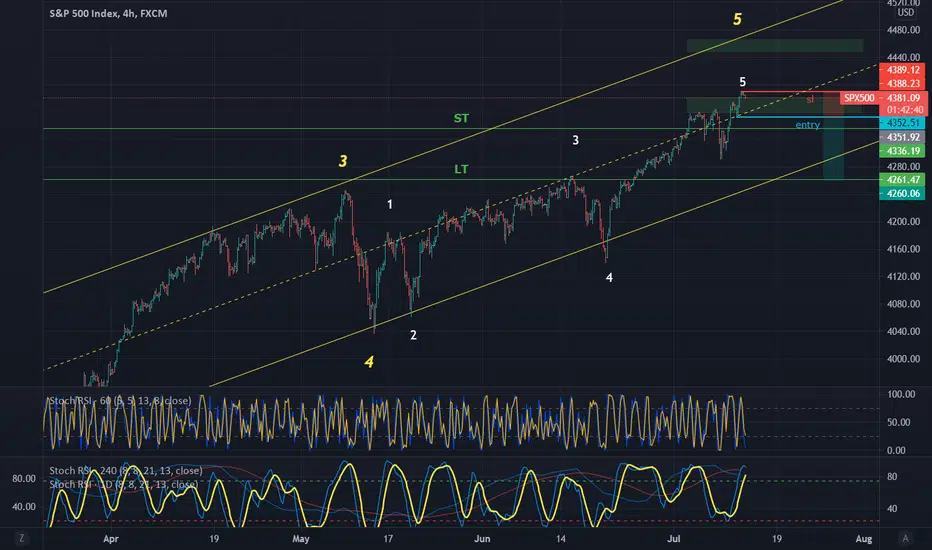
SPX 500 READY FOR A CORRECTION
2
取得這個圖表
2
187
TPs are shown with green lines.
if SPX goes under the cyan line it would be expected to see a big correction.
AG_investor
關注
正在關注
Chart Patterns
Technical Indicators
indicies
nasdaq
nyse
S&P 500 (SPX500)
usnas100
Wave Analysis
免責聲明
這些資訊和出版物並非旨在提供,也不構成TradingView提供或認可的任何形式的財務、投資、交易或其他類型的建議或推薦。請閱讀
使用條款
以了解更多資訊。
Chart Patterns
Technical Indicators
indicies
nasdaq
nyse
S&P 500 (SPX500)
usnas100
Wave Analysis
AG_investor
關注
正在關注
免責聲明
這些資訊和出版物並非旨在提供,也不構成TradingView提供或認可的任何形式的財務、投資、交易或其他類型的建議或推薦。請閱讀
使用條款
以了解更多資訊。