
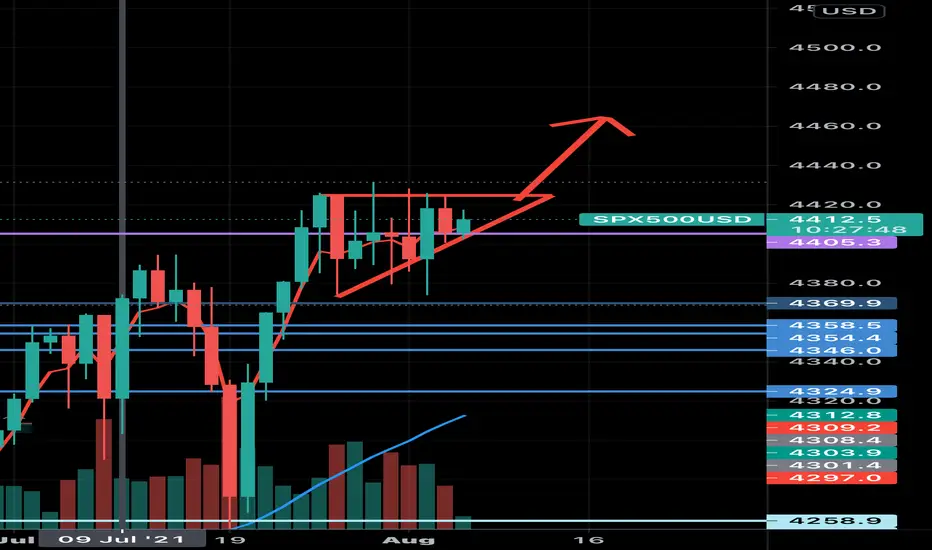
The S&P500 has been very bullish since the significant drop that occurred from July 15th to July 19th. Since then, the price action of the index has been creating an Ascending Triangle Formation; signifying a buy. I expect the index to breakout, retest(the best possible entry point), then be bullish into the 4460-4470 range.

免責聲明
這些資訊和出版物並非旨在提供,也不構成TradingView提供或認可的任何形式的財務、投資、交易或其他類型的建議或推薦。請閱讀使用條款以了解更多資訊。