
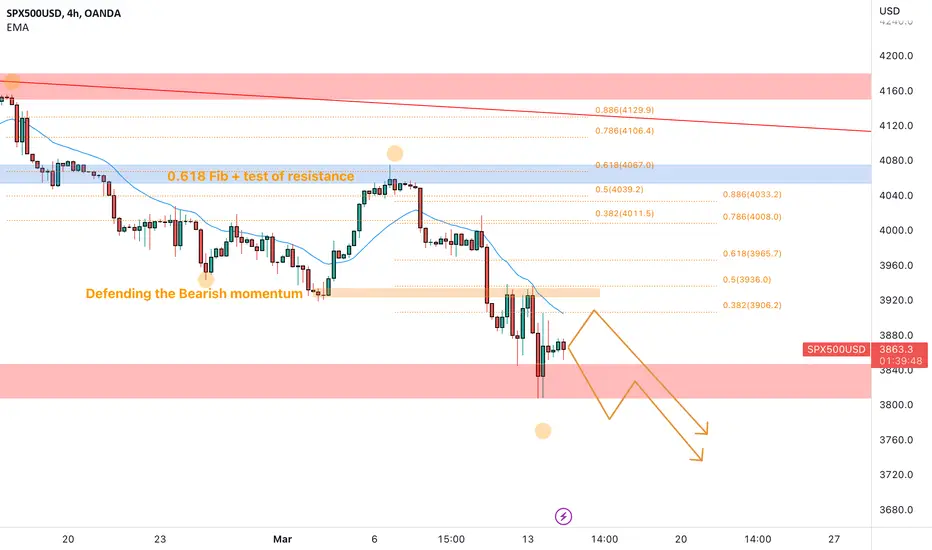
Based on the 4-hour timeframe, there are clear indications of a bearish trend in the S&P 500 index. After testing the weekly resistance level at 4160, the market started a bearish move with a series of lower lows and lower highs.
Further analysis shows that the market retraced to the 0.618 Fibonacci level after the first bearish impulse and tested a daily resistance level perfectly. This level is known as an inversion point, indicating a high likelihood of the market reversing its trend.
From there, the price created a second impulse toward the lower weekly support, indicating a continuation of the bearish trend.
As such, it may be wise to wait for a new opportunity to set a nice short order in anticipation of further price declines according to the Plancton's strategy rules.
Further analysis shows that the market retraced to the 0.618 Fibonacci level after the first bearish impulse and tested a daily resistance level perfectly. This level is known as an inversion point, indicating a high likelihood of the market reversing its trend.
From there, the price created a second impulse toward the lower weekly support, indicating a continuation of the bearish trend.
As such, it may be wise to wait for a new opportunity to set a nice short order in anticipation of further price declines according to the Plancton's strategy rules.
註釋
註釋

免責聲明
這些資訊和出版物並非旨在提供,也不構成TradingView提供或認可的任何形式的財務、投資、交易或其他類型的建議或推薦。請閱讀使用條款以了解更多資訊。