
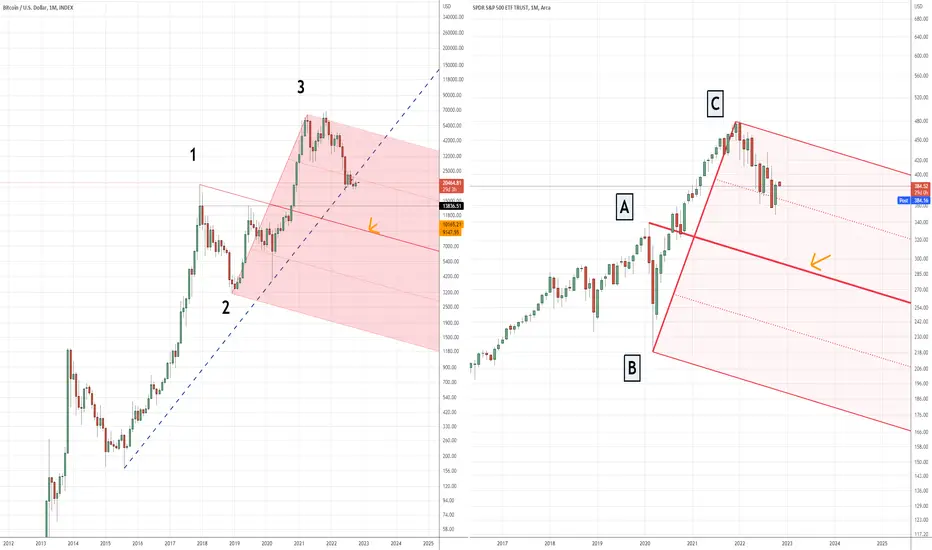
Both in in BTC and SPY charts we have Median Lines that worth a check:
In BTC prices are now under the 50% upside parallel Median Line and the current move could be a pullback of that level, in that case prices could be headed much lower , the Center Line is under 10K right now.
in SPY prices are above the 50% upside parallel but a move back under the 1/2 of the body of the last green candle ( ~373 ) should be seen as an alert to check in case of more downside there to come.
Knowing these patterns may help you have a geometrical map of where price are moving and where could be directed in the future.
No position just sharing the patterns.
In BTC prices are now under the 50% upside parallel Median Line and the current move could be a pullback of that level, in that case prices could be headed much lower , the Center Line is under 10K right now.
in SPY prices are above the 50% upside parallel but a move back under the 1/2 of the body of the last green candle ( ~373 ) should be seen as an alert to check in case of more downside there to come.
Knowing these patterns may help you have a geometrical map of where price are moving and where could be directed in the future.
No position just sharing the patterns.

相關出版品
免責聲明
這些資訊和出版物並非旨在提供,也不構成TradingView提供或認可的任何形式的財務、投資、交易或其他類型的建議或推薦。請閱讀使用條款以了解更多資訊。