
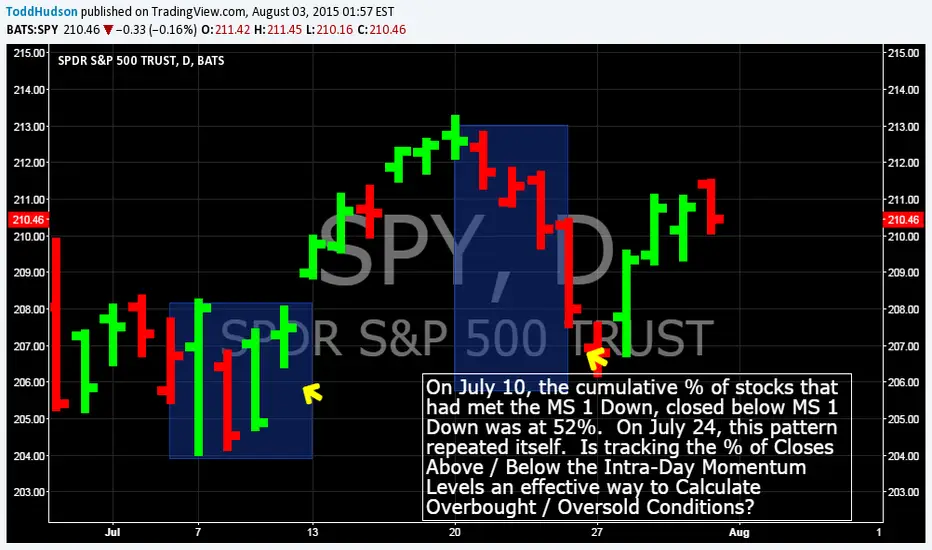
On July 10, the cumulative % of stocks that had met the MS 1 Down, closed below MS 1 Down was at 52%. On July 24, this pattern repeated itself. Is tracking the % of Closes Above / Below the Intra-Day Momentum Levels an effective way to Calculate Overbought / Oversold Conditions?

免責聲明
這些資訊和出版物並非旨在提供,也不構成TradingView提供或認可的任何形式的財務、投資、交易或其他類型的建議或推薦。請閱讀使用條款以了解更多資訊。
免責聲明
這些資訊和出版物並非旨在提供,也不構成TradingView提供或認可的任何形式的財務、投資、交易或其他類型的建議或推薦。請閱讀使用條款以了解更多資訊。