
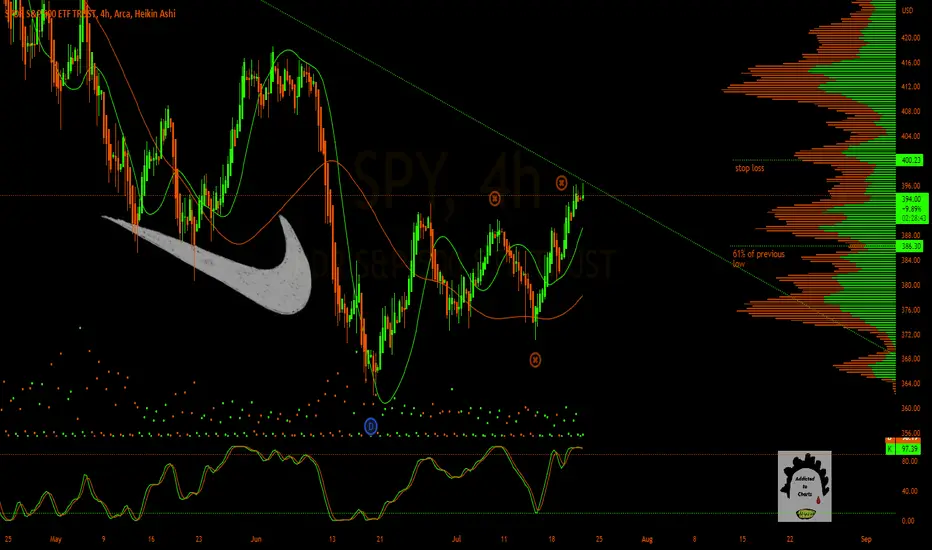
Looks like we may be at a pivot point. We are at an overbought area on the RSI. I believe that this may be an "abc" corrective wave pattern. We may be coming off of the C part of the wave. I didnt want to over mark the chart. Looking for a 61% Fibonacci retracement to the previous low. It's a fair fight around this area regarding bulls and bears volume so I recommend looking at volume analysis before we really see where price may go. Price may need to test this 200 HMA. However, I have my reasons to believe that this current rally needs a cooling down.
What do you think?
What do you think?

免責聲明
這些資訊和出版物並非旨在提供,也不構成TradingView提供或認可的任何形式的財務、投資、交易或其他類型的建議或推薦。請閱讀使用條款以了解更多資訊。
免責聲明
這些資訊和出版物並非旨在提供,也不構成TradingView提供或認可的任何形式的財務、投資、交易或其他類型的建議或推薦。請閱讀使用條款以了解更多資訊。