
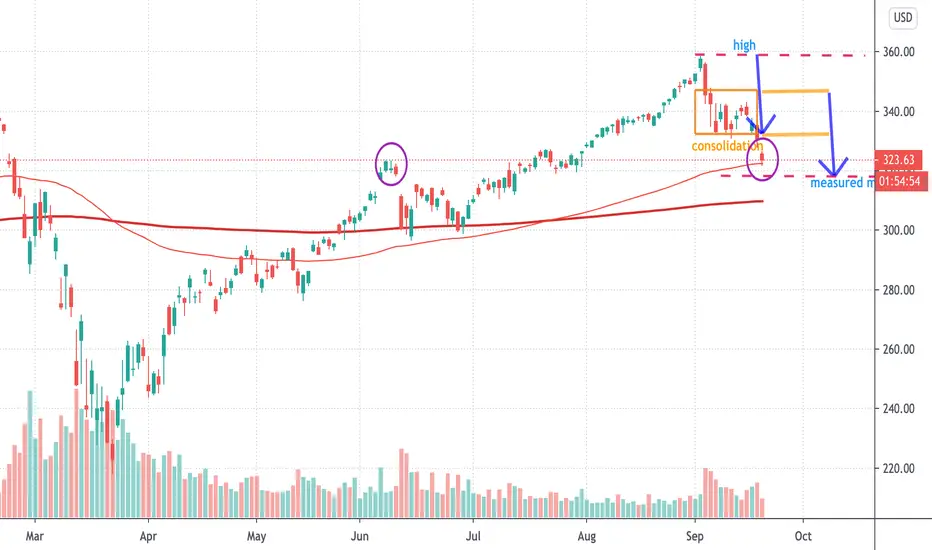
The  SPX sell-off from September 2nd highs, created a consolidation range (orange rectangle) from $330-340 approximately.
Making a measured move, with the consolidation constituting a half-way measuring flag structure (blue arrows).
100 exponential moving average is now the trend support, coincidental with June highs. Unfortunately, this is not a support trend historically market makers pay special attention to.
SPX sell-off from September 2nd highs, created a consolidation range (orange rectangle) from $330-340 approximately. Making a measured move, with the consolidation constituting a half-way measuring flag structure (blue arrows).
100 exponential moving average is now the trend support, coincidental with June highs. Unfortunately, this is not a support trend historically market makers pay special attention to.

免責聲明
這些資訊和出版物並非旨在提供,也不構成TradingView提供或認可的任何形式的財務、投資、交易或其他類型的建議或推薦。請閱讀使用條款以了解更多資訊。
免責聲明
這些資訊和出版物並非旨在提供,也不構成TradingView提供或認可的任何形式的財務、投資、交易或其他類型的建議或推薦。請閱讀使用條款以了解更多資訊。