
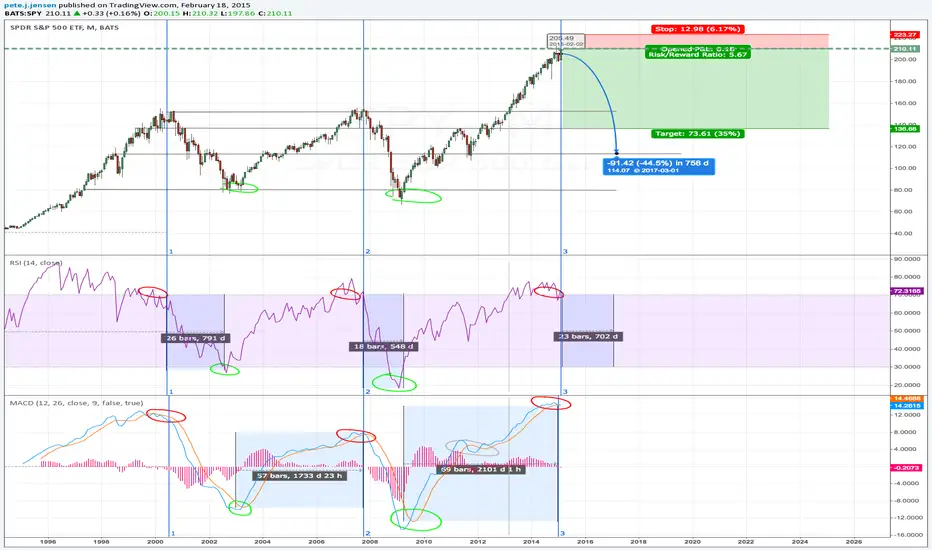
The stars are aligning for a pretty serious pullback in the US Equities Market.
The chart uses my two favorite indicators; RSI and MACD.
I've gone through and marked historical correlations on the chart for prior crashes for both indicators.
RSI going above 70; signals overvalued
RSI going below 30; signals underbought
MACD Converging (Red)
MACD Diverging (Green)
You'll see both of these correlate quite nicely with the two previous crashes.
**Projections**
I project a between a 30-40 percent pull back spanning nearly two years.
I've added a possible short position with a fairly tight tolerance for a good ratio.
I'll keep the chart updated in case we're looking at a false-top; given present valuations and P/E ratios I don't think we are.
The chart uses my two favorite indicators; RSI and MACD.
I've gone through and marked historical correlations on the chart for prior crashes for both indicators.
RSI going above 70; signals overvalued
RSI going below 30; signals underbought
MACD Converging (Red)
MACD Diverging (Green)
You'll see both of these correlate quite nicely with the two previous crashes.
**Projections**
I project a between a 30-40 percent pull back spanning nearly two years.
I've added a possible short position with a fairly tight tolerance for a good ratio.
I'll keep the chart updated in case we're looking at a false-top; given present valuations and P/E ratios I don't think we are.

免責聲明
這些資訊和出版物並非旨在提供,也不構成TradingView提供或認可的任何形式的財務、投資、交易或其他類型的建議或推薦。請閱讀使用條款以了解更多資訊。
免責聲明
這些資訊和出版物並非旨在提供,也不構成TradingView提供或認可的任何形式的財務、投資、交易或其他類型的建議或推薦。請閱讀使用條款以了解更多資訊。