
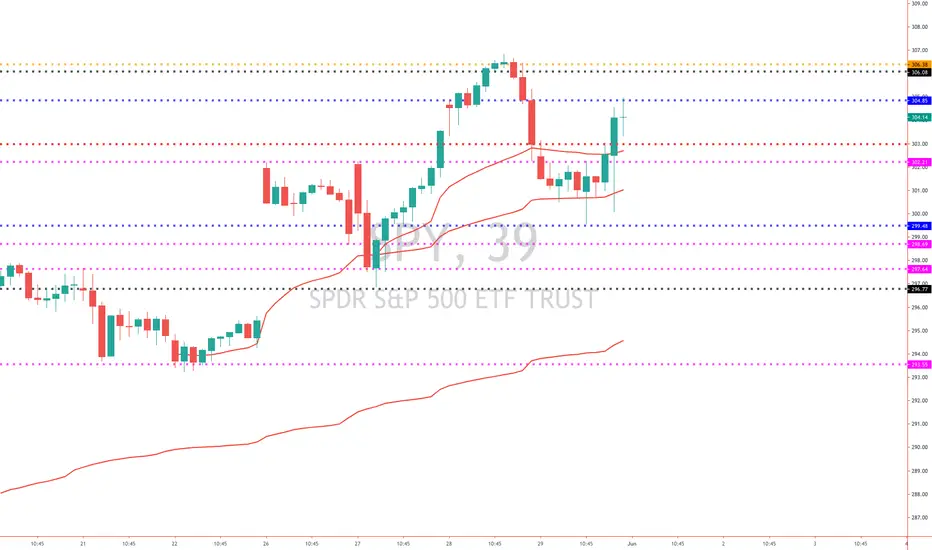
Spy Levels for the week .
Anchor Vwap to see potential key support
Anchor Vwap to see potential key support
註釋
Black lines - represent last week high and lowBlue lines - respresent previous day high and low
purple line- represents supports and resistance
yellow lines- represents last month high and low
Red indicator represents anchor vwap from previous lows and high. this also works as potential support to watch

免責聲明
這些資訊和出版物並非旨在提供,也不構成TradingView提供或認可的任何形式的財務、投資、交易或其他類型的建議或推薦。請閱讀使用條款以了解更多資訊。