
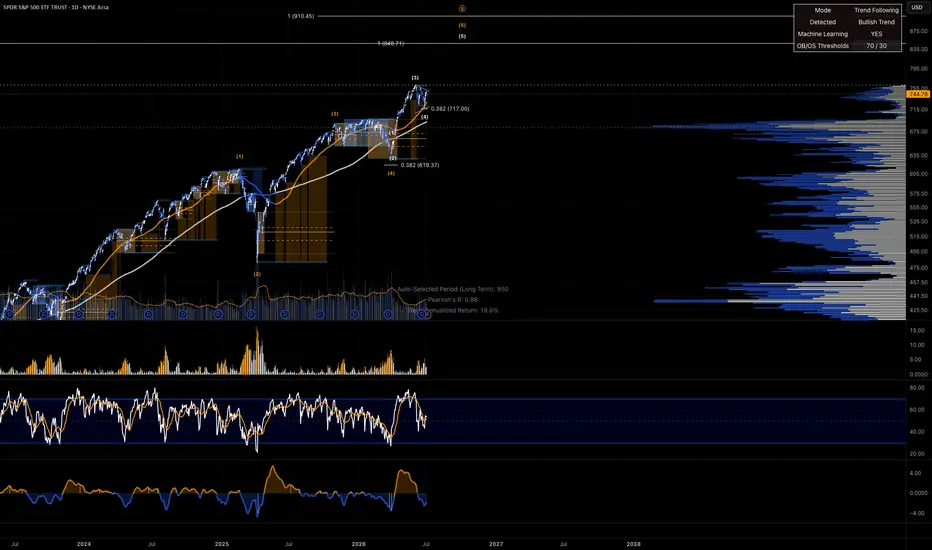
Wave 4 ending...
The NYSE/FINRA margin debt chart quantifies the total capital investors borrow against their securities portfolios to finance additional equity purchases. It operates as a procyclical indicator of market tops, typically expanding aggressively in the late stages of bull markets. At present, margin debt is approximately 53.7% year-over-year, reaching an extreme level of roughly $1.42 trillion.
The NYSE/FINRA margin debt chart quantifies the total capital investors borrow against their securities portfolios to finance additional equity purchases. It operates as a procyclical indicator of market tops, typically expanding aggressively in the late stages of bull markets. At present, margin debt is approximately 53.7% year-over-year, reaching an extreme level of roughly $1.42 trillion.

V/r,
NiGo
USN (Ret)...
nigonthailand.substack.com
NiGo
USN (Ret)...
nigonthailand.substack.com
免責聲明
這些資訊和出版物並非旨在提供,也不構成TradingView提供或認可的任何形式的財務、投資、交易或其他類型的建議或推薦。請閱讀使用條款以了解更多資訊。
V/r,
NiGo
USN (Ret)...
nigonthailand.substack.com
NiGo
USN (Ret)...
nigonthailand.substack.com
免責聲明
這些資訊和出版物並非旨在提供,也不構成TradingView提供或認可的任何形式的財務、投資、交易或其他類型的建議或推薦。請閱讀使用條款以了解更多資訊。