
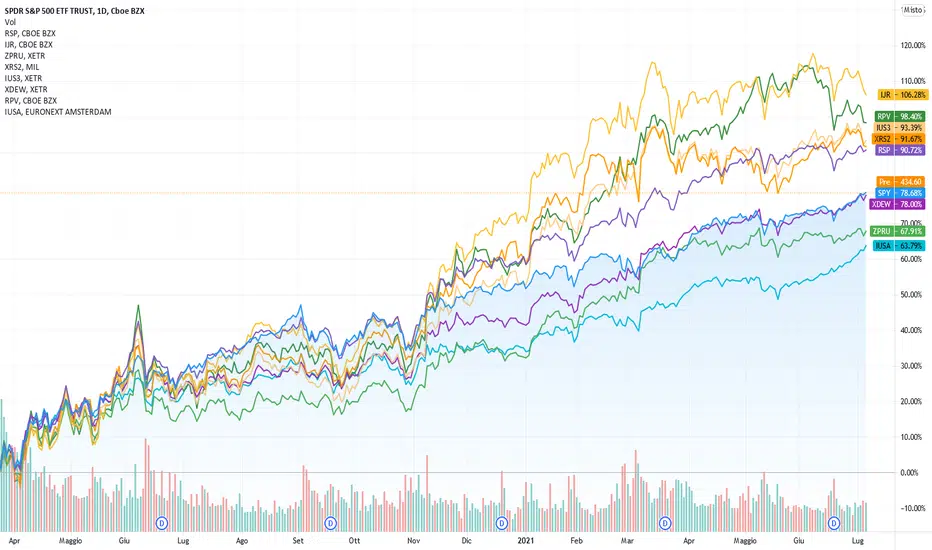
This image shows the performance of different ETF strategies after a market crash. For each strategy the chart shows a US listed ETF (first one) and one or more EU listed ETFs (all the following ones), this because the EUR/USD exchange creates a difference in the US and EU ETFs performance.
- bluish - S&P 500 baseline ( SPY / IUSA )
- purpleish - S&P 500 Equal Weight strategy ( RSP / XDEW )
- yellowish - SmallCap strategy - S&P Smallcap 600 and Russell 2000 ( IJR / IUS3 / XRS2 )
- greenish - S&P 500 Value strategy ( RPV / ZPRU )
The three strategies, Equal Weight, SmallCap and Value, all beated the baseline S&P 500.
- bluish - S&P 500 baseline ( SPY / IUSA )
- purpleish - S&P 500 Equal Weight strategy ( RSP / XDEW )
- yellowish - SmallCap strategy - S&P Smallcap 600 and Russell 2000 ( IJR / IUS3 / XRS2 )
- greenish - S&P 500 Value strategy ( RPV / ZPRU )
The three strategies, Equal Weight, SmallCap and Value, all beated the baseline S&P 500.

免責聲明
這些資訊和出版物並非旨在提供,也不構成TradingView提供或認可的任何形式的財務、投資、交易或其他類型的建議或推薦。請閱讀使用條款以了解更多資訊。