
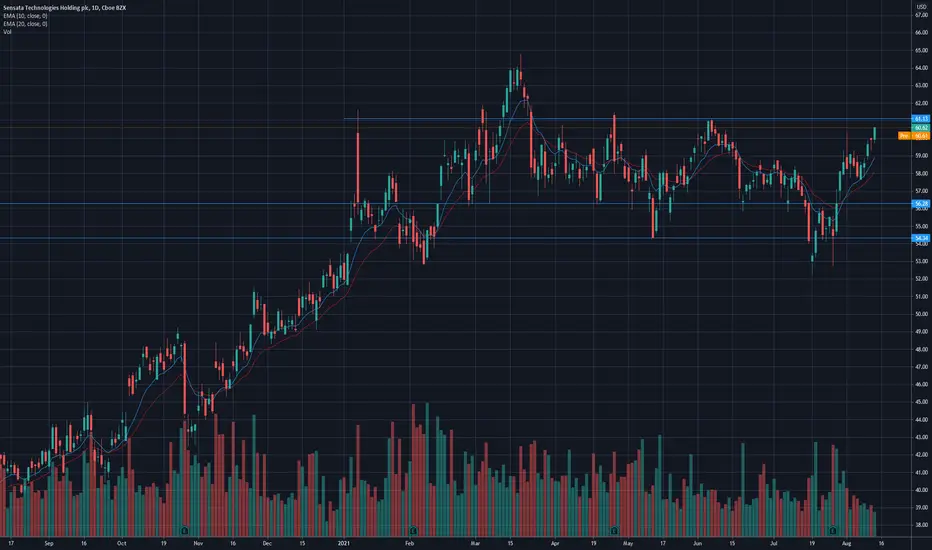
After using the highs from 2015 and 2018 ($56.28) as support, ST is now approaching the resistance of $61.13. Also note that ST has been ranging from year-to-date between $56.28 and $61.13.
Judging from the price action, it seems like ST may break and close above $61.13 in the coming week.
A rejection from $61.13 could have ST test the support of $59.90
Look for buying opportunities:
* Around the $59.90 area
OR
* After a daily close above $61.13
Judging from the price action, it seems like ST may break and close above $61.13 in the coming week.
A rejection from $61.13 could have ST test the support of $59.90
Look for buying opportunities:
* Around the $59.90 area
OR
* After a daily close above $61.13

免責聲明
這些資訊和出版物並非旨在提供,也不構成TradingView提供或認可的任何形式的財務、投資、交易或其他類型的建議或推薦。請閱讀使用條款以了解更多資訊。
免責聲明
這些資訊和出版物並非旨在提供,也不構成TradingView提供或認可的任何形式的財務、投資、交易或其他類型的建議或推薦。請閱讀使用條款以了解更多資訊。