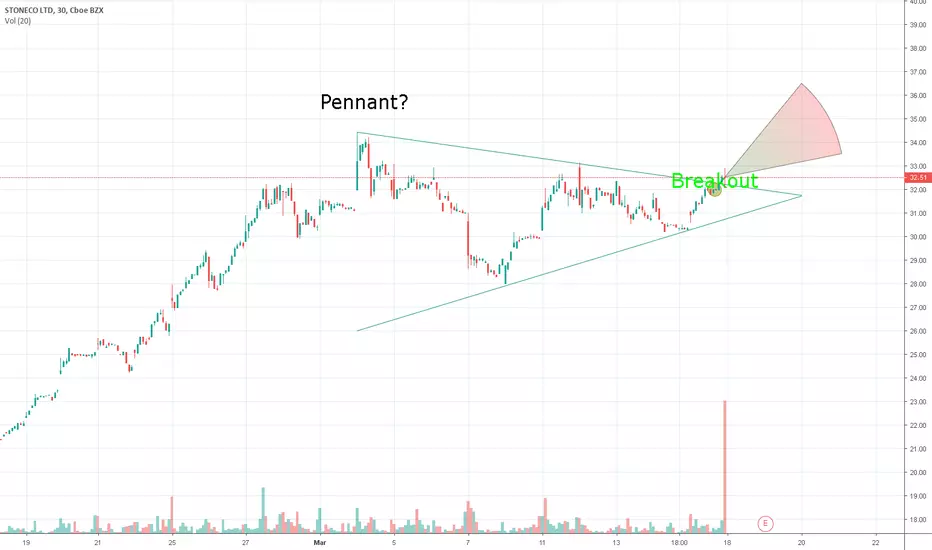
 STNE This is my first time doing chart patterns, but I think I am on to something here. We all know that STNE is a good long stock, but due to the recent bottom, it has been even more of a buy. If we look at the chart provided below, we can see that it almost fits the Pennant chart pattern. Im thinking once earnings comes, its gonna skyrocket all the way to $36.50, and then come down a bit due to people taking profits. Again this isn't really comprehensive and its my first time doing something like this so please take it with a grain of salt. Thank you.
註釋
Sorry, the predicted pattern on the chart doesn't reflect what I am saying, instead, look at the chart in the comments.
免責聲明
這些資訊和出版物並非旨在提供,也不構成TradingView提供或認可的任何形式的財務、投資、交易或其他類型的建議或推薦。請閱讀使用條款以了解更多資訊。
免責聲明
這些資訊和出版物並非旨在提供,也不構成TradingView提供或認可的任何形式的財務、投資、交易或其他類型的建議或推薦。請閱讀使用條款以了解更多資訊。