做多
Strat long term Chart analysis
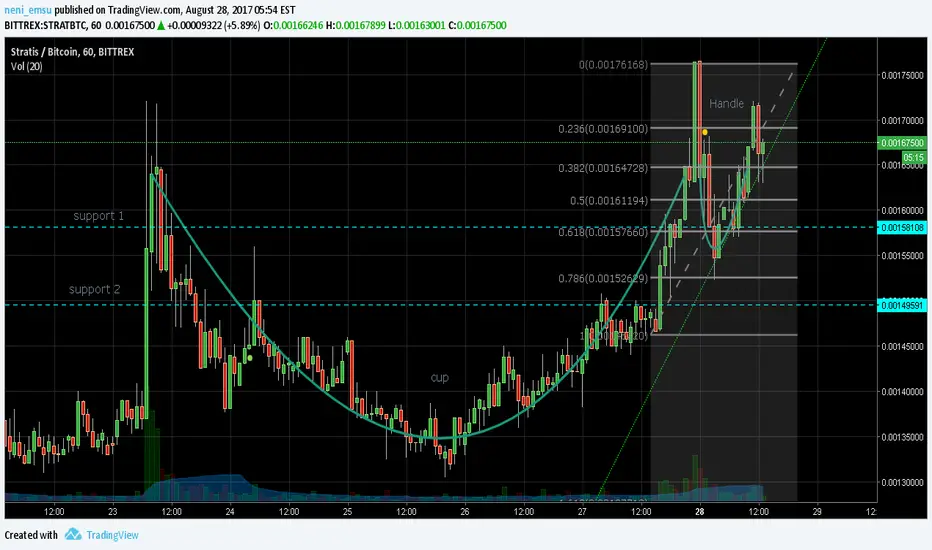
-A nice rounded bottom chart seen as the cup and handle formation comes in for a possible bullish trend confirmed by the new uptrend formed by the second part of the handle.
-Volume seams to have significantly increased.
-MACD indicates a short correction and also an increase in momentum
-If the candles break bellow trend line it would be expected to bounce at the support 1 61.8 Fibonacci line which is also a strongly tested support level.
-Further correction would see the charts move towards the second support and possibly a massive swing up.
Note:
-check for mote information Fundamental and Sentimental analysis to support finding before proceeding.
Do comment your thoughts and questions, Thank you.
-Volume seams to have significantly increased.
-MACD indicates a short correction and also an increase in momentum
-If the candles break bellow trend line it would be expected to bounce at the support 1 61.8 Fibonacci line which is also a strongly tested support level.
-Further correction would see the charts move towards the second support and possibly a massive swing up.
Note:
-check for mote information Fundamental and Sentimental analysis to support finding before proceeding.
Do comment your thoughts and questions, Thank you.

免責聲明
這些資訊和出版物並非旨在提供,也不構成TradingView提供或認可的任何形式的財務、投資、交易或其他類型的建議或推薦。請閱讀使用條款以了解更多資訊。