Stellar 4 Hour study.
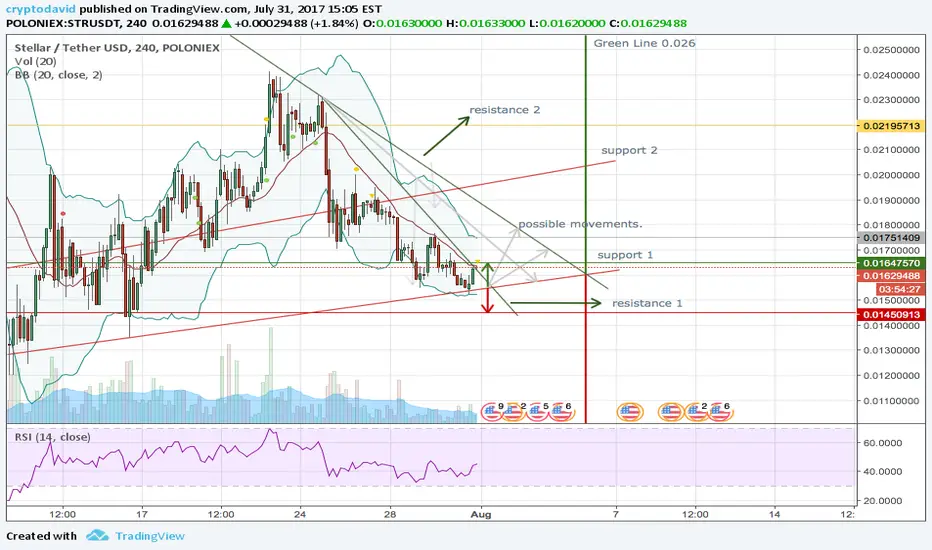
4 hour scenario
Breaking lines
First pair of lines
green line (resistance1) move towards 0.016 (Bollinger open up to 0.017)
red line (support1) move towards 0.014
Second pair of lines
Green line (resistance2) move towards 0.026
red line (support2) move towards 0.006
Market Cap 174.300.000
Shape could indicate double bottom, let´s see where it moves.
Wait for confirmation.
Breaking lines
First pair of lines
green line (resistance1) move towards 0.016 (Bollinger open up to 0.017)
red line (support1) move towards 0.014
Second pair of lines
Green line (resistance2) move towards 0.026
red line (support2) move towards 0.006
Market Cap 174.300.000
Shape could indicate double bottom, let´s see where it moves.
Wait for confirmation.

免責聲明
這些資訊和出版物並非旨在提供,也不構成TradingView提供或認可的任何形式的財務、投資、交易或其他類型的建議或推薦。請閱讀使用條款以了解更多資訊。
免責聲明
這些資訊和出版物並非旨在提供,也不構成TradingView提供或認可的任何形式的財務、投資、交易或其他類型的建議或推薦。請閱讀使用條款以了解更多資訊。