
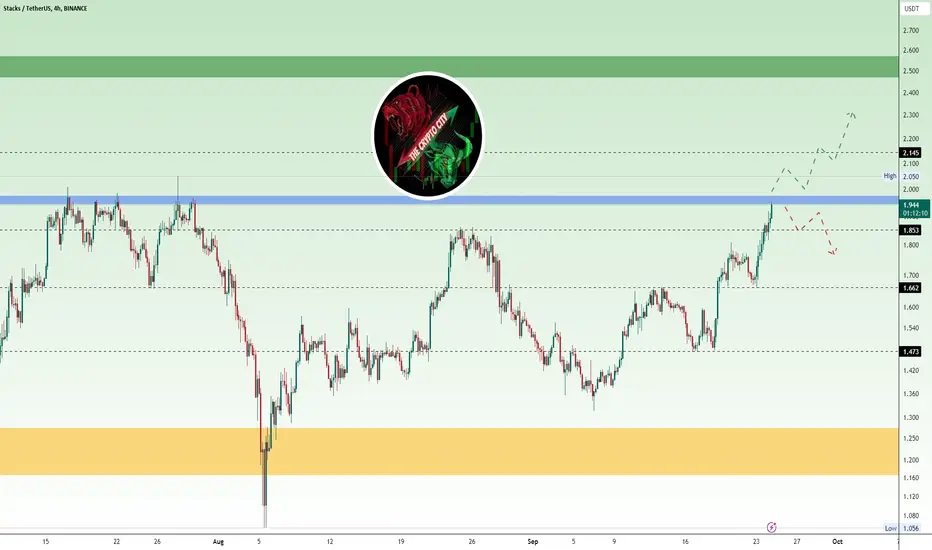
The STX/USDT chart shows the price testing a crucial resistance zone (Blue). A successful breakout above the resistance zone (Blue) could trigger a strong bullish wave. Failure to break this level may lead to further consolidation or downward movement.

免責聲明
這些資訊和出版物並非旨在提供,也不構成TradingView提供或認可的任何形式的財務、投資、交易或其他類型的建議或推薦。請閱讀使用條款以了解更多資訊。
免責聲明
這些資訊和出版物並非旨在提供,也不構成TradingView提供或認可的任何形式的財務、投資、交易或其他類型的建議或推薦。請閱讀使用條款以了解更多資訊。