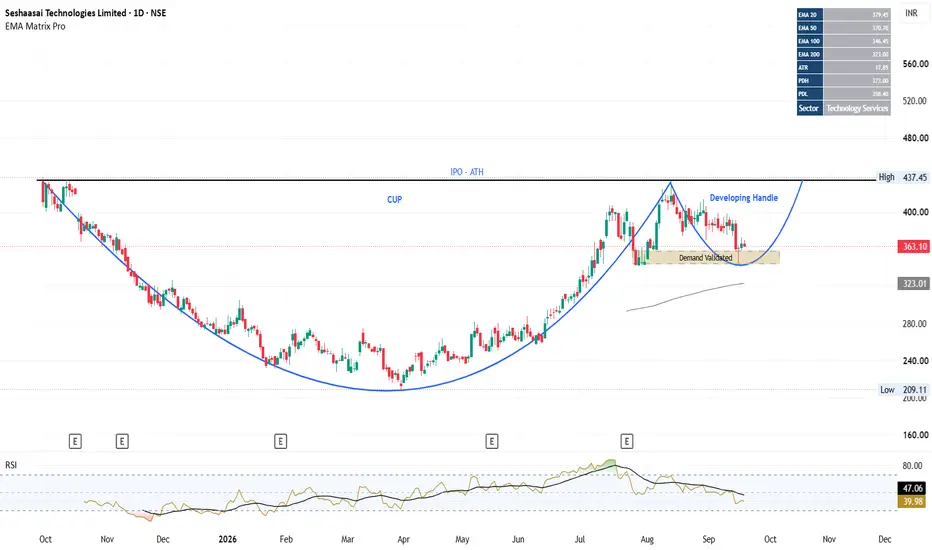
Seshaasai Technologies Ltd.  STYL is developing an interesting Cup & Handle structure on the daily chart, with the handle currently testing an important demand/confluence area.
Key Observations :
1. Cup formation: After the post-listing decline, price formed a broad base and recovered toward the IPO/major high zone around ₹433–437, completing the larger cup structure.
2. Supply reaction: The first attempt near the previous high was rejected, followed by another pullback. This indicates that the ₹433–437 area remains the major supply/resistance zone.
3. Handle development: The subsequent decline has so far held the ₹343–358 demand zone, which is close to the lower portion of the developing handle.
4. EMA confluence: The demand area is supported by the 100 EMA around ₹346.5, while the 50 EMA around ₹370.8 is currently acting as an intermediate dynamic level.
5. Momentum: RSI has cooled from the previous overbought region and is now around the neutral zone. This gives the handle room to develop without the stock remaining excessively extended.
Trade Plan:
Trigger:
A sustained move above ₹394 and RSI above 50 can be treated as a confirmation of the developing handle breakout / short-term structure reversal.
Upside levels:
₹437–438: Major resistance / previous high
Above ₹437–438: price discovery becomes possible, subject to breakout strength and volume.
Invalidation:
A decisive breakdown below the ₹343–358 demand zone, particularly a daily close below the lower boundary, would weaken the current Cup & Handle thesis.
Risk management:
Rather than entering solely because price is inside the demand zone, the cleaner setup is to wait for price confirmation above ₹394, preferably accompanied by expanding volume. Position size should be calculated according to the predefined risk per trade.
Important technical distinction:
₹394 does not validate the demand zone itself. It validates the handle/recovery structure. The demand-zone thesis is already supported by the reaction from ₹343–358; ₹394 is the potential confirmation trigger.
------------------------------------------------------------------------------------------------------------
Disclaimer: This is a personal technical-market observation for educational/informational purposes and is not investment advice. I am not a SEBI-registered investment adviser/research analyst. Please conduct your own research and manage risk according to your individual circumstances.
STYL is developing an interesting Cup & Handle structure on the daily chart, with the handle currently testing an important demand/confluence area.Key Observations :
1. Cup formation: After the post-listing decline, price formed a broad base and recovered toward the IPO/major high zone around ₹433–437, completing the larger cup structure.
2. Supply reaction: The first attempt near the previous high was rejected, followed by another pullback. This indicates that the ₹433–437 area remains the major supply/resistance zone.
3. Handle development: The subsequent decline has so far held the ₹343–358 demand zone, which is close to the lower portion of the developing handle.
4. EMA confluence: The demand area is supported by the 100 EMA around ₹346.5, while the 50 EMA around ₹370.8 is currently acting as an intermediate dynamic level.
5. Momentum: RSI has cooled from the previous overbought region and is now around the neutral zone. This gives the handle room to develop without the stock remaining excessively extended.
Trade Plan:
Trigger:
A sustained move above ₹394 and RSI above 50 can be treated as a confirmation of the developing handle breakout / short-term structure reversal.
Upside levels:
₹437–438: Major resistance / previous high
Above ₹437–438: price discovery becomes possible, subject to breakout strength and volume.
Invalidation:
A decisive breakdown below the ₹343–358 demand zone, particularly a daily close below the lower boundary, would weaken the current Cup & Handle thesis.
Risk management:
Rather than entering solely because price is inside the demand zone, the cleaner setup is to wait for price confirmation above ₹394, preferably accompanied by expanding volume. Position size should be calculated according to the predefined risk per trade.
Important technical distinction:
₹394 does not validate the demand zone itself. It validates the handle/recovery structure. The demand-zone thesis is already supported by the reaction from ₹343–358; ₹394 is the potential confirmation trigger.
------------------------------------------------------------------------------------------------------------
Disclaimer: This is a personal technical-market observation for educational/informational purposes and is not investment advice. I am not a SEBI-registered investment adviser/research analyst. Please conduct your own research and manage risk according to your individual circumstances.

免責聲明
這些資訊和出版物並非旨在提供,也不構成TradingView提供或認可的任何形式的財務、投資、交易或其他類型的建議或推薦。請閱讀使用條款以了解更多資訊。
免責聲明
這些資訊和出版物並非旨在提供,也不構成TradingView提供或認可的任何形式的財務、投資、交易或其他類型的建議或推薦。請閱讀使用條款以了解更多資訊。