
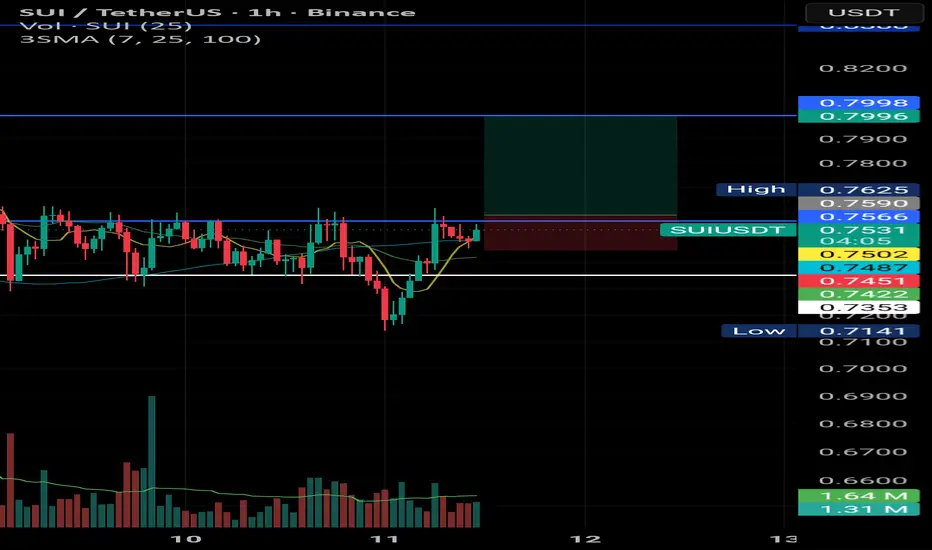
After a fake breakdown below the range low at 0.7353, price managed to reclaim the range and is now testing the 0.7566 resistance level.
A breakout above this level would complete a V-shaped recovery and could increase the probability of further upside.
Momentum indicators are showing signs of strengthening, with RSI moving toward the overbought region, suggesting growing buying pressure.
In this scenario, the next key levels to watch are 0.7998 and 0.8388.
A breakout above this level would complete a V-shaped recovery and could increase the probability of further upside.
Momentum indicators are showing signs of strengthening, with RSI moving toward the overbought region, suggesting growing buying pressure.
In this scenario, the next key levels to watch are 0.7998 and 0.8388.

免責聲明
這些資訊和出版物並非旨在提供,也不構成TradingView提供或認可的任何形式的財務、投資、交易或其他類型的建議或推薦。請閱讀使用條款以了解更多資訊。