
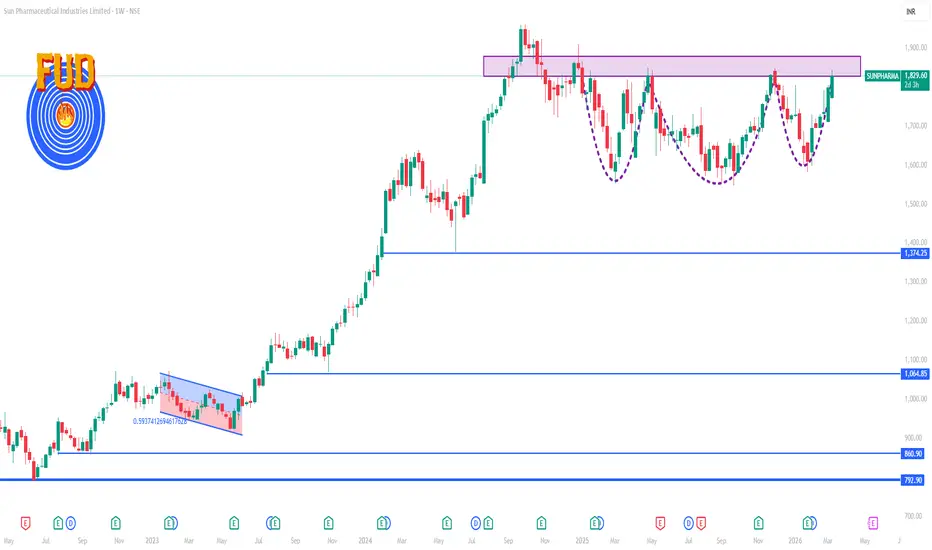
📍 Current Price (LIVE)
As of the latest market session (11 Mar 2026):
₹1,820 – ₹1,833 range — stock is trading near recent highs and close to its 52‑week high (~₹1,850).
This is your current base price for calculating weekly levels.
📈 1‑Week Key Levels (Approximate, Short‑Term Trading Focus)
🔹 Resistance Levels (Upside)
These mark potential zones where buyers may slow down or sellers could step in:
R1 (Immediate): ~₹1,840 – ₹1,845
R2: ~₹1,850 – ₹1,855 (near recent 52‑week high)
R3 (Bullish Breakout area): ~₹1,870+
A sustained breakout above ₹1,850–₹1,855 with volume could signal continuation uptrend.
🔻 Support Levels (Downside)
These are zones where the price may find buying interest / pullback support:
S1 (First): ~₹1,800 – ₹1,805
S2: ~₹1,780 – ₹1,785
S3 (Stronger): ~₹1,750 – ₹1,760
If price breaks below ₹1,780 this week, watch for deeper pullbacks toward ₹1,750.
🧠 Short‑Term Technical Reminder
The stock remains near the upper end of its recent trading range — above key shorter moving averages (20‑, 50‑DMA mostly bullish).
RSI/oscillators on short frames may show mild overbought if price stays near ₹1,850.
Breakout above weekly resistance (₹1,850+) could lead to short covering/range expansion.
📊 How to Use These Levels This Week
✅ Bullish bias: Price holding >₹1,800 with a break above ₹1,840 — next upside target ~₹1,850–₹1,870.
⚠️ Bearish bias (correction): Close below ₹1,780 — watch support near ₹1,750.
➡️ In‑between consolidation: Range ~₹1,780–₹1,840.

Contact Knowledgehub for a detailed consultation: Dm on WhatsApp: [wa.link/a2o0kz]-
Phone No: [+91 93102 26243]-
Email: [tradingviewknowledgehub@gmail.com]---
-- Let’s achieve success together!
Phone No: [+91 93102 26243]-
Email: [tradingviewknowledgehub@gmail.com]---
-- Let’s achieve success together!
相關出版品
免責聲明
這些資訊和出版物並非旨在提供,也不構成TradingView提供或認可的任何形式的財務、投資、交易或其他類型的建議或推薦。請閱讀使用條款以了解更多資訊。