SULZON Energy, India  SUZLON
Weekly Chart
Market Structure & Price Action
Indicators & Volume
Trading Idea
SUZLON Weekly Chart
Market Structure & Price Action
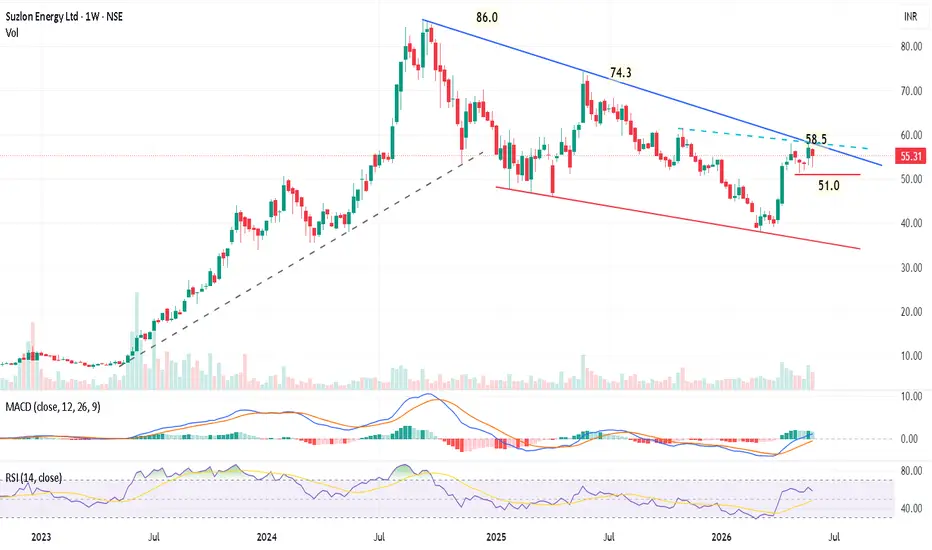
- Macro Pattern: Following a powerful multi-year uptrend, the price entered a major corrective phase, compressing inside a textbook macro Falling Wedge pattern since late 2024.
- Current Phase: The stock has staged a sharp, aggressive reversal from its structural lows near 40.0 and is currently challenging the upper converging resistance boundary (blue line) at 58.5.
- Support/Resistance: Immediate key support is firmly established at the 51.0 horizontal floor (solid orange line). A successful breakout shifts focus to the major historical structural targets at 74.3 and the macro peak at 86.0.
Indicators & Volume
- Volume: Trading volume has expanded significantly on the recent weekly advance, indicating strong institutional accumulation and the "coiled spring" dynamic typical of late-stage wedge patterns.
- MACD (12, 26, 9): Registering a highly bullish posture; a fresh crossover has triggered below the zero-line, accompanied by a steadily expanding positive histogram that confirms a massive influx of upward momentum.
- RSI (14): Tracking firmly at 58.35 and accelerating above its signal line (48.19), clearing the neutral 50 zone to signal that buyers have completely reclaimed control of the macro trend.
Trading Idea
- Entry Strategy: A confirmed weekly close above the wedge's descending resistance line at 58.5 triggers a high-probability breakout entry. Alternatively, look to build exposure on any minor retests of the 51.0 structural support.
- Target: Initial technical targets sit at 74.3, with a secondary macro projection mapping toward a full retest of the pattern's origin at 86.0.
- Stop Loss: The bullish structural thesis invalidates on a weekly close below the defined support level at 51.0.

免責聲明
這些資訊和出版物並非旨在提供,也不構成TradingView提供或認可的任何形式的財務、投資、交易或其他類型的建議或推薦。請閱讀使用條款以了解更多資訊。