做空
SYSBTC
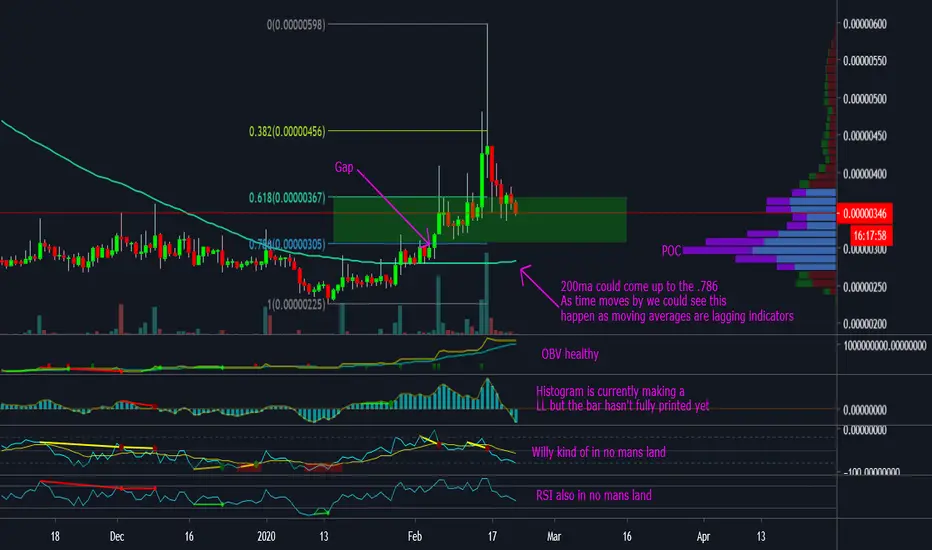
Looking at SYS on the daily
If you feel like you've missed out on the SYS this could be your second chance.
Looking to buy in the green zone, we hand a gap around 300 sats which also lines up with the .786 fib and the POC on VPVR
"Note" Histogram is still printing its last bar. What does this mean? If it prints lower the will more than likely continue down towards the 786 but if we print above we could see a continuation higher from here as the bulls are still in control of volume.
You could set some stink bids like I will be doing just in case someone decides to fat finger their puts.
If you like what I do, drop a comment, tell me what you think and don't forget to like and subscribing. Thanks :)
註釋
Confirmed and we move lover. Great buying opertunity 
免責聲明
這些資訊和出版物並非旨在提供,也不構成TradingView提供或認可的任何形式的財務、投資、交易或其他類型的建議或推薦。請閱讀使用條款以了解更多資訊。
免責聲明
這些資訊和出版物並非旨在提供,也不構成TradingView提供或認可的任何形式的財務、投資、交易或其他類型的建議或推薦。請閱讀使用條款以了解更多資訊。