
Long-Term Structure
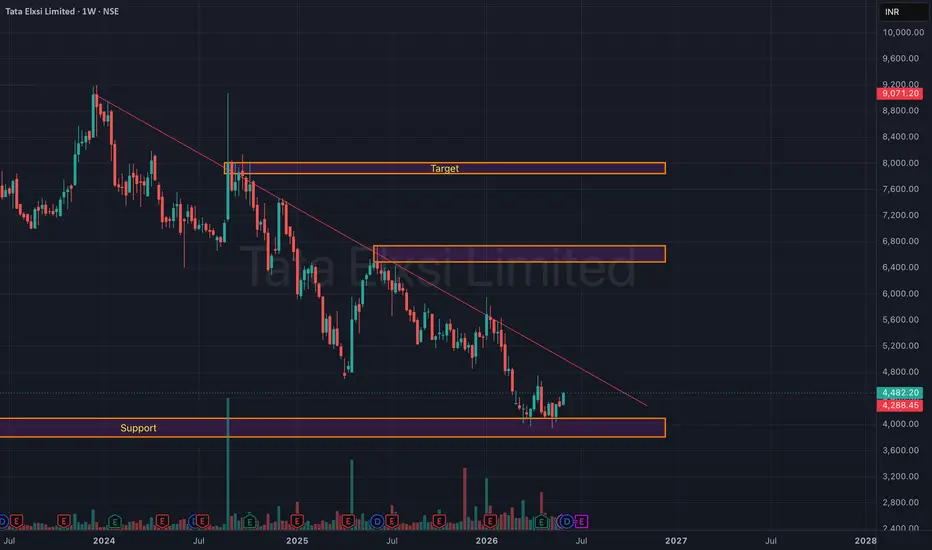
Since its peak near ₹9,000, the stock has been in a well-defined downtrend characterized by:
🔻 Lower Highs
🔻 Lower Lows
🔻 Persistent selling pressure
The red trendline on the chart has acted as dynamic resistance throughout the decline.
Major Demand Zone: ₹3,800 – ₹4,100
This zone has emerged as a strong support area where buyers have repeatedly stepped in.
Key observations:
✅ Multiple rejections from lower levels
✅ Formation of a base after capitulation
✅ Increased buying interest near support
✅ Risk-reward improving significantly
As long as price sustains above this zone, the possibility of a medium-term trend reversal remains alive.
Upside Targets
If the breakout sustains:
Target 1: ₹5,500 – ₹5,800
Target 2: ₹6,500 – ₹7,000
Major Target Zone: ₹7,800 – ₹8,000
This target area corresponds to the previous major supply zone highlighted on the chart.
Tata Elxsi is transitioning from a prolonged downtrend into a potential accumulation phase. The stock is positioned near a critical inflection point where a breakout above the falling trendline could trigger a meaningful trend reversal.
Since its peak near ₹9,000, the stock has been in a well-defined downtrend characterized by:
🔻 Lower Highs
🔻 Lower Lows
🔻 Persistent selling pressure
The red trendline on the chart has acted as dynamic resistance throughout the decline.
Major Demand Zone: ₹3,800 – ₹4,100
This zone has emerged as a strong support area where buyers have repeatedly stepped in.
Key observations:
✅ Multiple rejections from lower levels
✅ Formation of a base after capitulation
✅ Increased buying interest near support
✅ Risk-reward improving significantly
As long as price sustains above this zone, the possibility of a medium-term trend reversal remains alive.
Upside Targets
If the breakout sustains:
Target 1: ₹5,500 – ₹5,800
Target 2: ₹6,500 – ₹7,000
Major Target Zone: ₹7,800 – ₹8,000
This target area corresponds to the previous major supply zone highlighted on the chart.
Tata Elxsi is transitioning from a prolonged downtrend into a potential accumulation phase. The stock is positioned near a critical inflection point where a breakout above the falling trendline could trigger a meaningful trend reversal.

免責聲明
這些資訊和出版物並非旨在提供,也不構成TradingView提供或認可的任何形式的財務、投資、交易或其他類型的建議或推薦。請閱讀使用條款以了解更多資訊。
免責聲明
這些資訊和出版物並非旨在提供,也不構成TradingView提供或認可的任何形式的財務、投資、交易或其他類型的建議或推薦。請閱讀使用條款以了解更多資訊。