
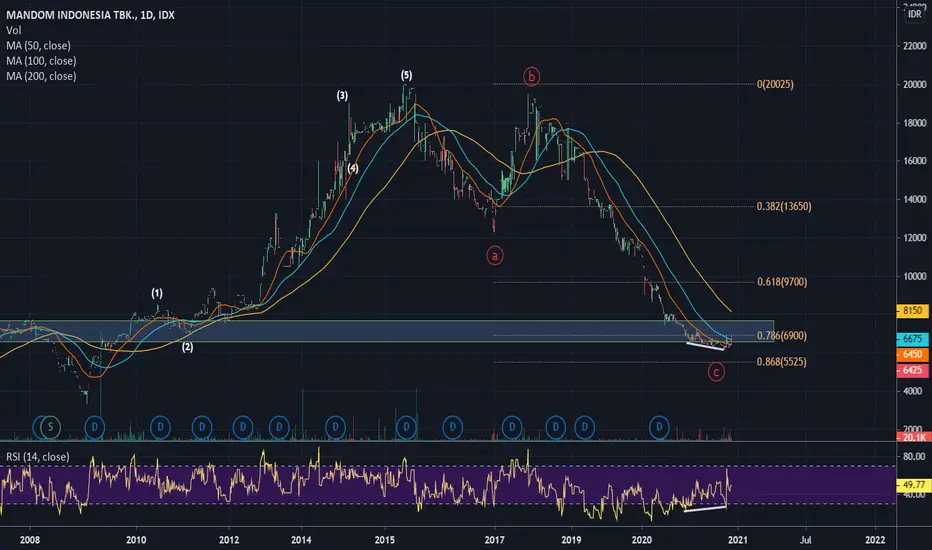
Based on elliottwave theory, I am confident enough to say that the bearish trend is almost over. A zig-zag correction pattern is formed from a-b-c label, the price also hover around strong support range. I think the accumulation phase is happening now.
RSI indicating bullish divergence. Let's see if price can hold above MA 50 and MA 100 in coming weeks.
Cheers happy investing !
RSI indicating bullish divergence. Let's see if price can hold above MA 50 and MA 100 in coming weeks.
Cheers happy investing !

免責聲明
這些資訊和出版物並非旨在提供,也不構成TradingView提供或認可的任何形式的財務、投資、交易或其他類型的建議或推薦。請閱讀使用條款以了解更多資訊。