
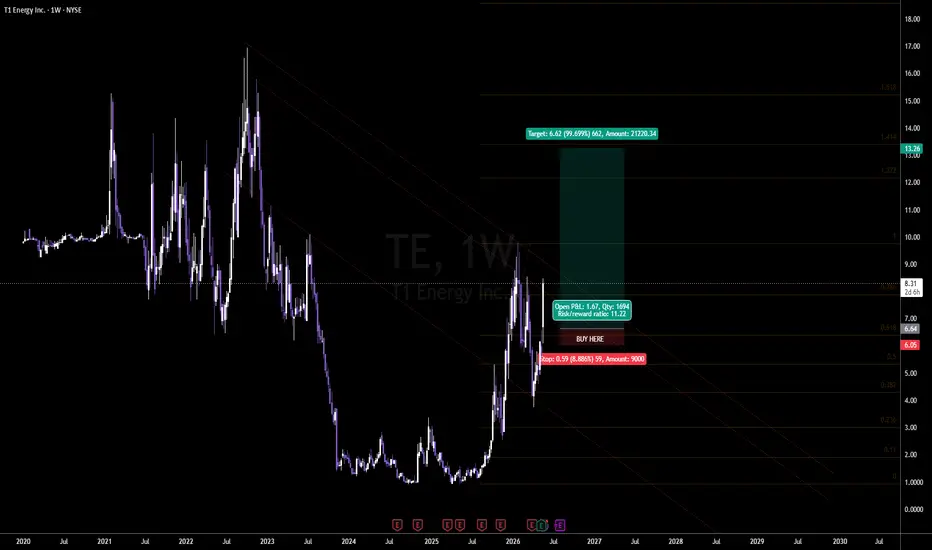
T1 Energy is still in the middle of a long cyclical recovery process, and the weekly chart is showing something more important than just a bounce. It looks like an attempt to form a new base after a major multi-year drawdown, with price now pushing back into the recovery zone rather than making fresh lows. 📈
That matters because when a beaten-up energy name starts reclaiming structure on the weekly timeframe, it often means the market is beginning to reprice the story before the fundamentals fully show up in reported numbers.
The macro backdrop is part of the reason this stock can matter. Energy-linked and infrastructure-sensitive names tend to respond to broader capital rotation, commodity pricing, and risk appetite, especially when investors are looking for higher-beta opportunities outside the megacap growth complex. ⚡
TE also sits in a speculative part of the market, so it can move sharply when sentiment flips, which makes weekly structure far more important than short-term noise.
Fundamentally, the setup is still a recovery story. The market is likely watching whether TE can stabilize its business profile, improve sentiment around the sector, and continue to attract buyers who are willing to pay for a turnaround rather than only for current earnings power. 🧠 That is why the chart matters here, because the market often starts pricing the recovery before the numbers confirm it. If the broader tape becomes more supportive for energy and small-cap cyclicals, this kind of chart can move very fast.
🟢 Buy Zone 1 - Weekly Continuation Buy
📊 The idea is not that the stock is already fully healed, but that it is trying to build the kind of weekly base that can support a much larger move if buyers keep stepping in.
Entry: 6.64
Stop: 6.05
Target: 13.26
This setup is attractive because the downside is clearly defined while the upside still offers a large expansion if the recovery thesis plays out.
The stop sits below the support band and the lower part of the weekly structure, so a break below 6.05 would suggest the base is failing rather than just consolidating. 🎯 In other words, this is a recovery trade with a clean line in the sand.
🟢 What the chart is saying
The weekly structure shows price trying to rebuild from a long period of weakness. That is important because the move off the lows is not happening in isolation; it is happening after a prolonged washout, which gives the chart room to mean-revert higher if sentiment and sector rotation cooperate. 📈 The rising structure also suggests that sellers are no longer fully in control, even though the stock is still volatile and the base is still developing.
The deeper context is that TE is not a pristine momentum leader. It is a turnaround-type chart, which means traders need to respect that the move can be violent in both directions. That is why the weekly support zone matters so much. If price keeps holding above 6.05, the market is still accepting the idea of recovery. If not, the thesis is broken and the chart likely needs more time. ⚠️
🎯 Primary Thesis & Risk Management
The core thesis is simple. TE is trying to transition from a damaged post-downtrend chart into a weekly recovery base, and the current buy zone gives a defined way to participate if that transition continues. 📈
The combination of sector sensitivity, speculative beta, and a potential re-rating in the energy and infrastructure space makes this one worth watching if capital starts rotating into smaller cyclicals.
Risk management is straightforward. If price respects the 6.05 area and the weekly structure stays intact, the setup remains valid. If TE loses that level, the idea shifts from recovery attempt to failed leg and risk should be cut without hesitation. ⚠️ The trade works only if the market confirms the base, not if it merely pauses inside a downtrend.
That matters because when a beaten-up energy name starts reclaiming structure on the weekly timeframe, it often means the market is beginning to reprice the story before the fundamentals fully show up in reported numbers.
The macro backdrop is part of the reason this stock can matter. Energy-linked and infrastructure-sensitive names tend to respond to broader capital rotation, commodity pricing, and risk appetite, especially when investors are looking for higher-beta opportunities outside the megacap growth complex. ⚡
TE also sits in a speculative part of the market, so it can move sharply when sentiment flips, which makes weekly structure far more important than short-term noise.
Fundamentally, the setup is still a recovery story. The market is likely watching whether TE can stabilize its business profile, improve sentiment around the sector, and continue to attract buyers who are willing to pay for a turnaround rather than only for current earnings power. 🧠 That is why the chart matters here, because the market often starts pricing the recovery before the numbers confirm it. If the broader tape becomes more supportive for energy and small-cap cyclicals, this kind of chart can move very fast.
🟢 Buy Zone 1 - Weekly Continuation Buy
📊 The idea is not that the stock is already fully healed, but that it is trying to build the kind of weekly base that can support a much larger move if buyers keep stepping in.
Entry: 6.64
Stop: 6.05
Target: 13.26
This setup is attractive because the downside is clearly defined while the upside still offers a large expansion if the recovery thesis plays out.
The stop sits below the support band and the lower part of the weekly structure, so a break below 6.05 would suggest the base is failing rather than just consolidating. 🎯 In other words, this is a recovery trade with a clean line in the sand.
🟢 What the chart is saying
The weekly structure shows price trying to rebuild from a long period of weakness. That is important because the move off the lows is not happening in isolation; it is happening after a prolonged washout, which gives the chart room to mean-revert higher if sentiment and sector rotation cooperate. 📈 The rising structure also suggests that sellers are no longer fully in control, even though the stock is still volatile and the base is still developing.
The deeper context is that TE is not a pristine momentum leader. It is a turnaround-type chart, which means traders need to respect that the move can be violent in both directions. That is why the weekly support zone matters so much. If price keeps holding above 6.05, the market is still accepting the idea of recovery. If not, the thesis is broken and the chart likely needs more time. ⚠️
🎯 Primary Thesis & Risk Management
The core thesis is simple. TE is trying to transition from a damaged post-downtrend chart into a weekly recovery base, and the current buy zone gives a defined way to participate if that transition continues. 📈
The combination of sector sensitivity, speculative beta, and a potential re-rating in the energy and infrastructure space makes this one worth watching if capital starts rotating into smaller cyclicals.
Risk management is straightforward. If price respects the 6.05 area and the weekly structure stays intact, the setup remains valid. If TE loses that level, the idea shifts from recovery attempt to failed leg and risk should be cut without hesitation. ⚠️ The trade works only if the market confirms the base, not if it merely pauses inside a downtrend.

免責聲明
這些資訊和出版物並非旨在提供,也不構成TradingView提供或認可的任何形式的財務、投資、交易或其他類型的建議或推薦。請閱讀使用條款以了解更多資訊。
免責聲明
這些資訊和出版物並非旨在提供,也不構成TradingView提供或認可的任何形式的財務、投資、交易或其他類型的建議或推薦。請閱讀使用條款以了解更多資訊。