 TGT
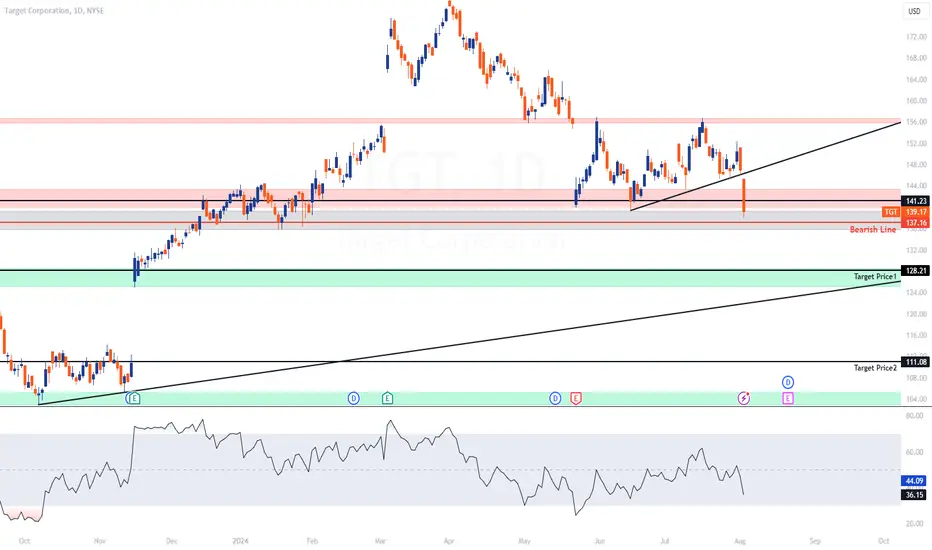
TGT Technical Analysis of Target Corporation (TGT)
Key Observations:
Current Price Action:
Price: $139.17
Recent Drop: -7.85 (-5.34%)
Support and Resistance Levels:
Immediate Support: $137.16 (Bearish Line)
Further Supports: $128.21 (Target Price 1), and $111.08 (Target Price 2)
Resistance: The price recently broke below a support level at around $141.23.
Trendlines:
The price has broken below a key upward trendline, indicating a potential shift from a bullish to a bearish trend.
Relative Strength Index (RSI):
Current RSI: 44.09
The RSI shows a decline, approaching the oversold zone, indicating increasing selling pressure.
Target Prices:
Target Price 1: $128.21
This level is the immediate support and a potential first target for any continued downward movement.
Target Price 2: $111.08
If the price breaks below the immediate support, the next target is around $111.08, a significant support level.
Summary:
Target Corporation (TGT) has experienced a significant drop, breaking below a key support level and its upward trendline. The next levels to watch are $137.16, $128.21, and $111.08. The RSI indicates potential for further declines if market conditions remain negative.
交易結束:目標達成

免責聲明
這些資訊和出版物並非旨在提供,也不構成TradingView提供或認可的任何形式的財務、投資、交易或其他類型的建議或推薦。請閱讀使用條款以了解更多資訊。